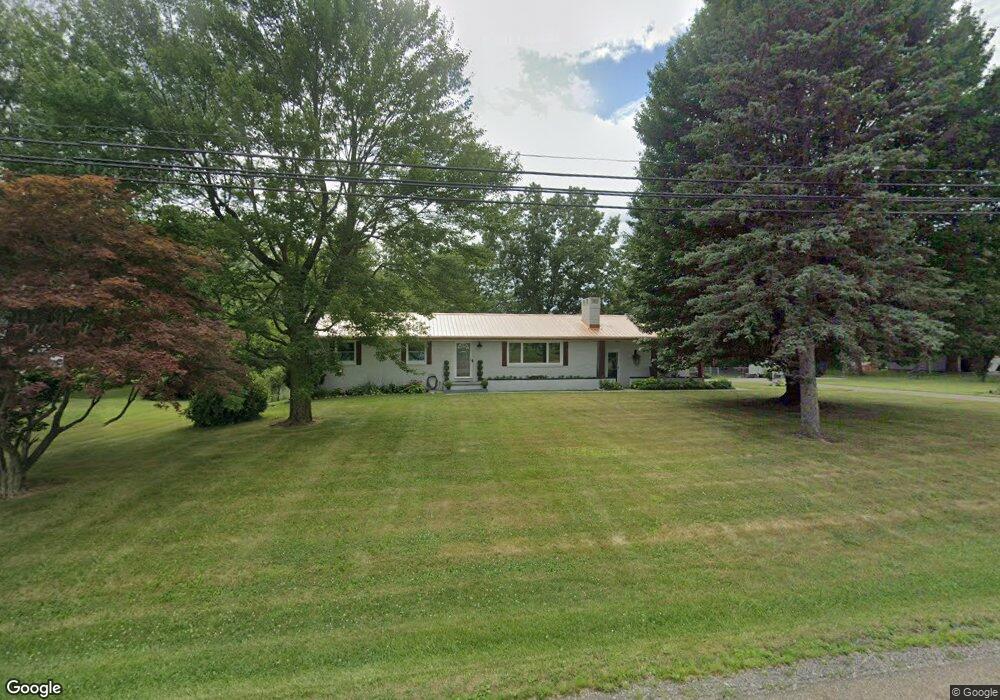
7025 Ravenna Ave Louisville, OH 44641
Estimated Value: $206,000 - $278,000
2
Beds
3
Baths
1,352
Sq Ft
$183/Sq Ft
Est. Value
About This Home
This home is located at 7025 Ravenna Ave, Louisville, OH 44641 and is currently estimated at $247,555, approximately $183 per square foot. 7025 Ravenna Ave is a home located in Stark County with nearby schools including Louisville High School and St. Thomas Aquinas High School & Middle School.
Ownership History
Date
Name
Owned For
Owner Type
Purchase Details
Closed on
Jun 23, 2015
Sold by
Skropits Dale L and Skropits Denise L
Bought by
Skropits Family Trust and Skropits Denise L
Current Estimated Value
Purchase Details
Closed on
Oct 23, 2009
Sold by
Dent Mary
Bought by
Skropits Dale L and Skropits Denise L
Home Financials for this Owner
Home Financials are based on the most recent Mortgage that was taken out on this home.
Original Mortgage
$90,000
Outstanding Balance
$58,739
Interest Rate
5.07%
Mortgage Type
New Conventional
Estimated Equity
$188,816
Purchase Details
Closed on
Aug 31, 2006
Sold by
Tate Kathleen
Bought by
Dent Mary
Purchase Details
Closed on
Jul 19, 2006
Sold by
Seber John N and Seber Janita S
Bought by
Tate Kathleen
Purchase Details
Closed on
Aug 25, 2005
Sold by
Graham Luella
Bought by
Seber John N and Seber Janita S
Purchase Details
Closed on
Jun 15, 2004
Sold by
Graham Carleton D and Graham Luella
Bought by
Graham Carleton D and Graham Luella
Create a Home Valuation Report for This Property
The Home Valuation Report is an in-depth analysis detailing your home's value as well as a comparison with similar homes in the area
Home Values in the Area
Average Home Value in this Area
Purchase History
| Date | Buyer | Sale Price | Title Company |
|---|---|---|---|
| Skropits Family Trust | -- | None Available | |
| Skropits Dale L | $135,000 | Attorney | |
| Dent Mary | $133,100 | None Available | |
| Tate Kathleen | $162,500 | None Available | |
| Seber John N | $151,000 | -- | |
| Graham Carleton D | -- | -- |
Source: Public Records
Mortgage History
| Date | Status | Borrower | Loan Amount |
|---|---|---|---|
| Open | Skropits Dale L | $90,000 |
Source: Public Records
Tax History Compared to Growth
Tax History
| Year | Tax Paid | Tax Assessment Tax Assessment Total Assessment is a certain percentage of the fair market value that is determined by local assessors to be the total taxable value of land and additions on the property. | Land | Improvement |
|---|---|---|---|---|
| 2025 | -- | $75,850 | $17,820 | $58,030 |
| 2024 | -- | $75,850 | $17,820 | $58,030 |
| 2023 | $3,094 | $63,460 | $14,810 | $48,650 |
| 2022 | $1,550 | $63,460 | $14,810 | $48,650 |
| 2021 | $3,110 | $63,460 | $14,810 | $48,650 |
| 2020 | $2,469 | $53,210 | $12,710 | $40,500 |
| 2019 | $2,479 | $53,210 | $12,710 | $40,500 |
| 2018 | $2,471 | $53,210 | $12,710 | $40,500 |
| 2017 | $2,301 | $47,270 | $11,840 | $35,430 |
| 2016 | $2,194 | $46,110 | $11,140 | $34,970 |
| 2015 | $2,200 | $46,110 | $11,140 | $34,970 |
| 2014 | -- | $42,500 | $10,260 | $32,240 |
| 2013 | $1,099 | $42,500 | $10,260 | $32,240 |
Source: Public Records
Map
Nearby Homes
- 7844 Morningstar Dr
- 6285 California Ave
- 6079 Eastlawn St NE
- 3580 Brookridge Ave Lot 15
- 5474 Ravenna Ave
- 6150 Pilot View Cir
- 0 Glenbar St
- 0 Brookridge Ave
- 524 Glenbar St
- 6052 N Nickelplate St
- 316 E Reno Dr
- 614 Reno Dr
- 5700 Glena St
- 0 Pilot Knob Ave NE
- 1561 Noel St
- 910 Crosswyck Cir
- 428 Honeycrisp Dr NE
- 3047 Mcintosh Dr NE
- 432 Honeycrisp Dr NE
- 2962 Mcintosh Dr NE
- 7005 Ravenna Ave
- 7059 Ravenna Ave
- 7069 Ravenna Ave
- 6975 Ravenna Ave
- 7085 Ravenna Ave
- 7106 Ravenna Ave
- 7115 Ravenna Ave
- 6929 Ravenna Ave
- 6911 Ravenna Ave
- 6903 Ravenna Ave
- 6900 Ravenna Ave
- 6877 Ravenna Ave
- 7346 Columbus Rd
- 7433 Easton St
- 7203 Ravenna Ave
- 7417 Easton St
- 7370 Columbus Rd NE
- 7370 Columbus Rd
- 7397 Easton St
- 6852 Ravenna Ave