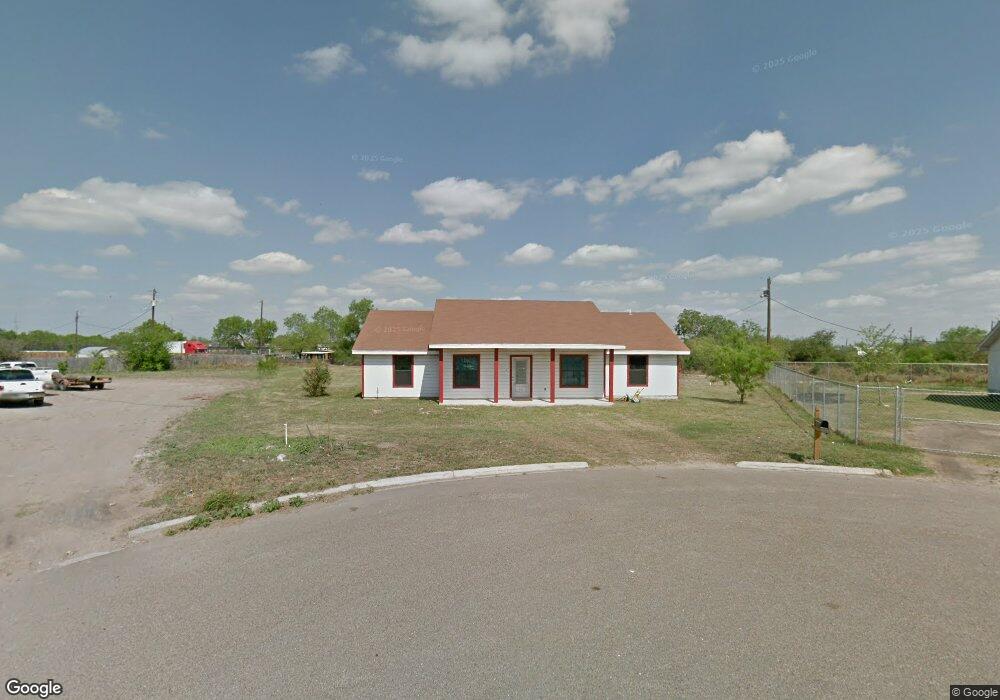
7026 Cortez St Weslaco, TX 78599
Estimated Value: $152,000 - $218,000
3
Beds
2
Baths
1,626
Sq Ft
$122/Sq Ft
Est. Value
About This Home
This home is located at 7026 Cortez St, Weslaco, TX 78599 and is currently estimated at $197,837, approximately $121 per square foot. 7026 Cortez St is a home located in Hidalgo County with nearby schools including Raul A Gonzalez Jr Elementary School, Mary Hoge Middle School, and Weslaco East High School.
Ownership History
Date
Name
Owned For
Owner Type
Purchase Details
Closed on
Sep 21, 2017
Sold by
Secretary Of Hud
Bought by
Aguirre Maria Del Rosario
Current Estimated Value
Home Financials for this Owner
Home Financials are based on the most recent Mortgage that was taken out on this home.
Original Mortgage
$85,000
Outstanding Balance
$70,962
Interest Rate
3.89%
Mortgage Type
New Conventional
Estimated Equity
$126,875
Purchase Details
Closed on
Jan 19, 2017
Sold by
Wells Fargo Bank Na
Bought by
The Secretary Of Housing And Urban Devel
Purchase Details
Closed on
Jan 27, 2011
Sold by
Compass Bank
Bought by
Castillo Joanna
Home Financials for this Owner
Home Financials are based on the most recent Mortgage that was taken out on this home.
Original Mortgage
$73,000
Interest Rate
4.83%
Mortgage Type
FHA
Purchase Details
Closed on
Dec 6, 2005
Sold by
Rodriguez Gilberto
Bought by
Palo Rajo Inc
Create a Home Valuation Report for This Property
The Home Valuation Report is an in-depth analysis detailing your home's value as well as a comparison with similar homes in the area
Home Values in the Area
Average Home Value in this Area
Purchase History
| Date | Buyer | Sale Price | Title Company |
|---|---|---|---|
| Aguirre Maria Del Rosario | -- | Sierra Title | |
| The Secretary Of Housing And Urban Devel | -- | None Available | |
| Castillo Joanna | -- | Vltc | |
| Palo Rajo Inc | -- | None Available |
Source: Public Records
Mortgage History
| Date | Status | Borrower | Loan Amount |
|---|---|---|---|
| Open | Aguirre Maria Del Rosario | $85,000 | |
| Previous Owner | Castillo Joanna | $73,000 |
Source: Public Records
Tax History Compared to Growth
Tax History
| Year | Tax Paid | Tax Assessment Tax Assessment Total Assessment is a certain percentage of the fair market value that is determined by local assessors to be the total taxable value of land and additions on the property. | Land | Improvement |
|---|---|---|---|---|
| 2025 | $2,949 | $195,903 | $66,132 | $129,771 |
| 2024 | $2,949 | $157,393 | $66,132 | $91,261 |
| 2023 | $2,964 | $159,583 | $66,132 | $93,451 |
| 2022 | $2,088 | $110,928 | $31,964 | $78,964 |
| 2021 | $1,881 | $97,869 | $31,964 | $65,905 |
| 2020 | $1,731 | $86,933 | $31,964 | $54,969 |
| 2019 | $1,771 | $85,066 | $31,964 | $53,102 |
| 2018 | $1,788 | $85,688 | $31,964 | $53,724 |
| 2017 | $1,794 | $86,311 | $31,964 | $54,347 |
| 2016 | $1,618 | $77,821 | $31,964 | $45,857 |
| 2015 | $1,835 | $78,336 | $31,964 | $46,372 |
Source: Public Records
Map
Nearby Homes
- 1946 E Mile 12 N
- 7125 N Mile 4 1/2 W
- 3408 Emma Dr
- 3507 Emma Dr
- 3405 Emma Dr
- 1301 Fairway Dr
- 3404 Emma Dr
- 3406 Emma Dr
- 3402 Emma Dr
- 7514 Shilo Dr
- 7511 Big Valley Dr Unit 13
- 305 Tahiti Dr
- 7909 Big Valley Dr
- 605 Juan Seguin St
- 305 Sonoma St
- 208 Napa St
- 7054 Oakville St
- 10.00 Acres N Mile 4 W
- 1433 E Mile 11 N
- 0 E Mile 11 N