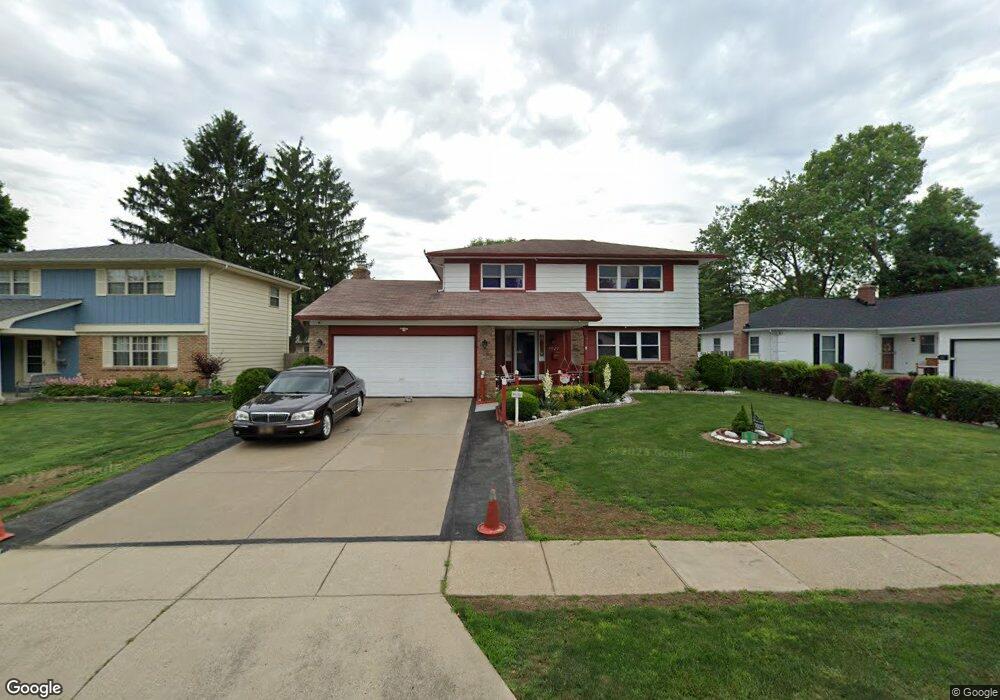
7027 Roundelay Rd N Reynoldsburg, OH 43068
Estimated Value: $311,902 - $328,000
4
Beds
3
Baths
1,856
Sq Ft
$173/Sq Ft
Est. Value
About This Home
This home is located at 7027 Roundelay Rd N, Reynoldsburg, OH 43068 and is currently estimated at $321,476, approximately $173 per square foot. 7027 Roundelay Rd N is a home located in Franklin County with nearby schools including Rose Hill Elementary School, Waggoner Road Elementary School, and Waggoner Road Junior High School.
Ownership History
Date
Name
Owned For
Owner Type
Purchase Details
Closed on
Feb 21, 2015
Sold by
Stephenson Martha A and Stephenson Morris
Bought by
Knox Stephenson Martha A
Current Estimated Value
Home Financials for this Owner
Home Financials are based on the most recent Mortgage that was taken out on this home.
Original Mortgage
$92,800
Outstanding Balance
$70,815
Interest Rate
3.66%
Mortgage Type
New Conventional
Estimated Equity
$250,661
Purchase Details
Closed on
Nov 20, 2000
Sold by
Katz Nathan P and Katz Denise
Bought by
Stephenson Morris and Stephenson Martha A
Home Financials for this Owner
Home Financials are based on the most recent Mortgage that was taken out on this home.
Original Mortgage
$116,000
Interest Rate
7.87%
Purchase Details
Closed on
Nov 21, 1979
Bought by
Katz Nathan P and Katz Denise
Purchase Details
Closed on
Mar 1, 1977
Create a Home Valuation Report for This Property
The Home Valuation Report is an in-depth analysis detailing your home's value as well as a comparison with similar homes in the area
Home Values in the Area
Average Home Value in this Area
Purchase History
| Date | Buyer | Sale Price | Title Company |
|---|---|---|---|
| Knox Stephenson Martha A | -- | Monarch Title | |
| Stephenson Morris | $145,000 | -- | |
| Katz Nathan P | -- | -- | |
| -- | $53,000 | -- |
Source: Public Records
Mortgage History
| Date | Status | Borrower | Loan Amount |
|---|---|---|---|
| Open | Knox Stephenson Martha A | $92,800 | |
| Previous Owner | Stephenson Morris | $116,000 |
Source: Public Records
Tax History Compared to Growth
Tax History
| Year | Tax Paid | Tax Assessment Tax Assessment Total Assessment is a certain percentage of the fair market value that is determined by local assessors to be the total taxable value of land and additions on the property. | Land | Improvement |
|---|---|---|---|---|
| 2024 | $6,774 | $89,570 | $24,500 | $65,070 |
| 2023 | $4,377 | $89,565 | $24,500 | $65,065 |
| 2022 | $3,875 | $60,000 | $12,290 | $47,710 |
| 2021 | $3,890 | $60,000 | $12,290 | $47,710 |
| 2020 | $3,969 | $60,000 | $12,290 | $47,710 |
| 2019 | $3,640 | $49,880 | $10,260 | $39,620 |
| 2018 | $3,568 | $49,880 | $10,260 | $39,620 |
| 2017 | $3,624 | $49,880 | $10,260 | $39,620 |
| 2016 | $3,608 | $44,210 | $8,470 | $35,740 |
| 2015 | $3,496 | $44,210 | $8,470 | $35,740 |
| 2014 | $3,512 | $44,210 | $8,470 | $35,740 |
| 2013 | $1,800 | $46,550 | $8,925 | $37,625 |
Source: Public Records
Map
Nearby Homes
- 6930 Tanya Terrace
- 857 Promise Ct
- 6890 Nocturne Rd N
- 6849 Roundelay Rd N
- 1094 Briarcliff Rd
- 1070 Tiffany Dr
- 6810 Prior Place
- 1140 Roundelay Rd E
- 664 Bainbrook Ct
- 6800 Frey Ln
- 0 Rosehill Rd
- 6737 Rocky Den Rd
- 7287 Saratoga Ave
- 7358 Roshon Ave
- 1177 Matterhorn Dr
- 7357 Sabre Ave
- 7353 Wollam Ave
- 6700 Helm Ln
- 7352 Saratoga Ave
- 7406 Warwick Ave
- 7035 Roundelay Rd N
- 7019 Roundelay Rd N
- 7010 Nocturne Rd N
- 7004 Nocturne Rd N
- 7043 Roundelay Rd N
- 7011 Roundelay Rd N
- 7016 Nocturne Rd N
- 7026 Roundelay Rd N
- 7034 Roundelay Rd N
- 6998 Nocturne Rd N
- 7020 Roundelay Rd N
- 7042 Roundelay Rd N
- 7003 Roundelay Rd N
- 7005 White Butterfly Ln
- 7048 Roundelay Rd N
- 6992 Nocturne Rd N
- 7024 Nocturne Rd N
- 6991 Roundelay Rd N
- 7055 Roundelay Rd N
- 7015 Nocturne Rd N