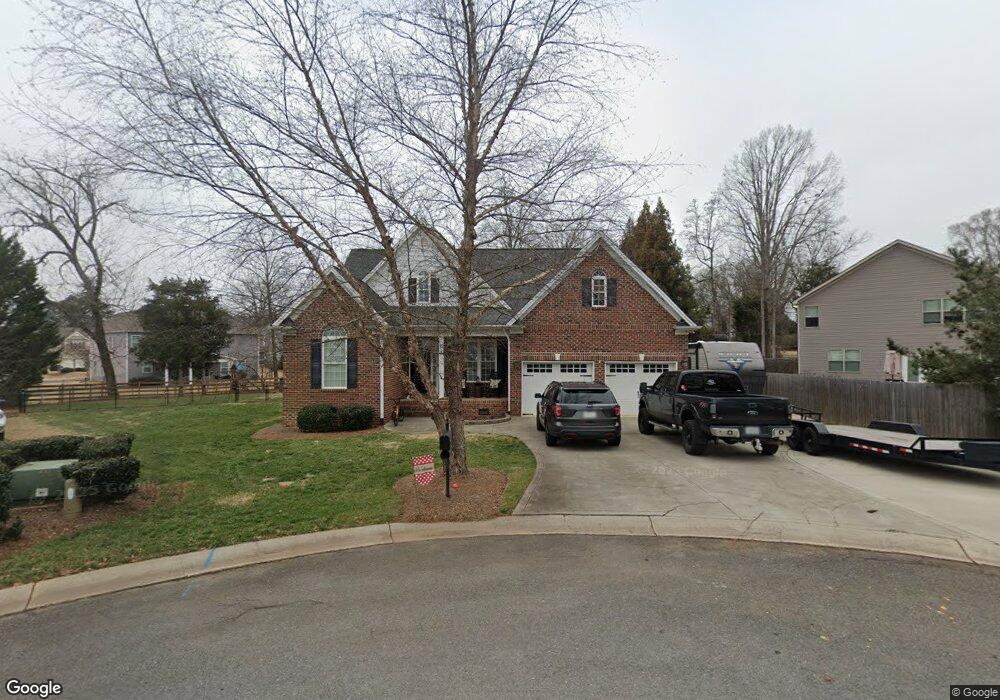
7028 Highland Way Belmont, NC 28012
Estimated Value: $461,000 - $503,000
3
Beds
2
Baths
2,111
Sq Ft
$226/Sq Ft
Est. Value
About This Home
This home is located at 7028 Highland Way, Belmont, NC 28012 and is currently estimated at $476,262, approximately $225 per square foot. 7028 Highland Way is a home located in Gaston County with nearby schools including J B Page Elementary School, Belmont Central Elementary School, and Belmont Middle School.
Ownership History
Date
Name
Owned For
Owner Type
Purchase Details
Closed on
Aug 28, 2018
Sold by
Austin Alan and Austin Tammy
Bought by
Johnson Jason and Johnson Jami
Current Estimated Value
Home Financials for this Owner
Home Financials are based on the most recent Mortgage that was taken out on this home.
Original Mortgage
$244,200
Outstanding Balance
$212,518
Interest Rate
4.5%
Mortgage Type
FHA
Estimated Equity
$263,744
Purchase Details
Closed on
Dec 11, 2014
Sold by
Hinkle Anthony S and Hinkle Emily
Bought by
Austin Alan and Austin Tammy
Home Financials for this Owner
Home Financials are based on the most recent Mortgage that was taken out on this home.
Original Mortgage
$245,000
Interest Rate
4.5%
Mortgage Type
Adjustable Rate Mortgage/ARM
Purchase Details
Closed on
Dec 5, 2006
Sold by
Peninsula Homes Llc
Bought by
Hinkle Anthony S
Home Financials for this Owner
Home Financials are based on the most recent Mortgage that was taken out on this home.
Original Mortgage
$157,900
Interest Rate
6.87%
Mortgage Type
Construction
Create a Home Valuation Report for This Property
The Home Valuation Report is an in-depth analysis detailing your home's value as well as a comparison with similar homes in the area
Home Values in the Area
Average Home Value in this Area
Purchase History
| Date | Buyer | Sale Price | Title Company |
|---|---|---|---|
| Johnson Jason | $255,000 | None Available | |
| Austin Alan | $245,000 | None Available | |
| Hinkle Anthony S | $34,000 | None Available |
Source: Public Records
Mortgage History
| Date | Status | Borrower | Loan Amount |
|---|---|---|---|
| Open | Johnson Jason | $244,200 | |
| Previous Owner | Austin Alan | $245,000 | |
| Previous Owner | Hinkle Anthony S | $157,900 |
Source: Public Records
Tax History Compared to Growth
Tax History
| Year | Tax Paid | Tax Assessment Tax Assessment Total Assessment is a certain percentage of the fair market value that is determined by local assessors to be the total taxable value of land and additions on the property. | Land | Improvement |
|---|---|---|---|---|
| 2025 | $3,123 | $437,450 | $42,000 | $395,450 |
| 2024 | $3,123 | $437,450 | $42,000 | $395,450 |
| 2023 | $3,040 | $437,450 | $42,000 | $395,450 |
| 2022 | $2,331 | $253,370 | $36,000 | $217,370 |
| 2021 | $2,230 | $253,370 | $36,000 | $217,370 |
| 2019 | $2,176 | $248,370 | $36,000 | $212,370 |
| 2018 | $1,973 | $216,761 | $32,000 | $184,761 |
| 2017 | $1,973 | $216,761 | $32,000 | $184,761 |
| 2016 | $1,994 | $216,761 | $0 | $0 |
| 2014 | $1,906 | $204,022 | $40,000 | $164,022 |
Source: Public Records
Map
Nearby Homes
- 232 Morgans Branch Rd
- 114 Warren Dr
- 974 Armstrong Rd
- 1028 Moonlight Mist Rd
- 1032 Moonlight Mist Rd
- 8013 Waterview Dr Unit 4
- 8112 Bayview Ln Unit 32
- 934 Armstrong Rd
- 246 Quiet Waters Rd Unit 18
- 164 Reese Wilson Rd
- 2901 S Point Rd
- 9263 Egret Ridge
- 2915 S Point Rd
- 1010 Nutall Oak Ln
- 1029 Glade Spring Ct
- 1120 Verdant Ridge Cir
- 2113 Wood Clough Ct
- 2112 Wood Clough Ct
- 1037 Nutall Oak Ln
- 3124 Ashwood Park Dr
- 1338 Armstrong Rd
- 108 Serenade Ct Unit 34
- 108 Serenade Ct
- 7029 Highland Way
- 112 Serenade Ct Unit 35
- 7025 Highland Way
- 104 Serenade Ct
- 104 Woodclough Ct
- 100 Woodclough Ct
- 100 Serenade Ct
- 7021 Highland Way
- 1344 Armstrong Rd
- 109 Serenade Ct
- 152 Morgan's Branch Rd Unit 27
- 164 Morgans Branch Rd
- 160 Morgans Branch Rd
- 156 Morgans Branch Rd
- 1329 Armstrong Rd
- 7016 Highland Way
- 168 Morgans Branch Rd