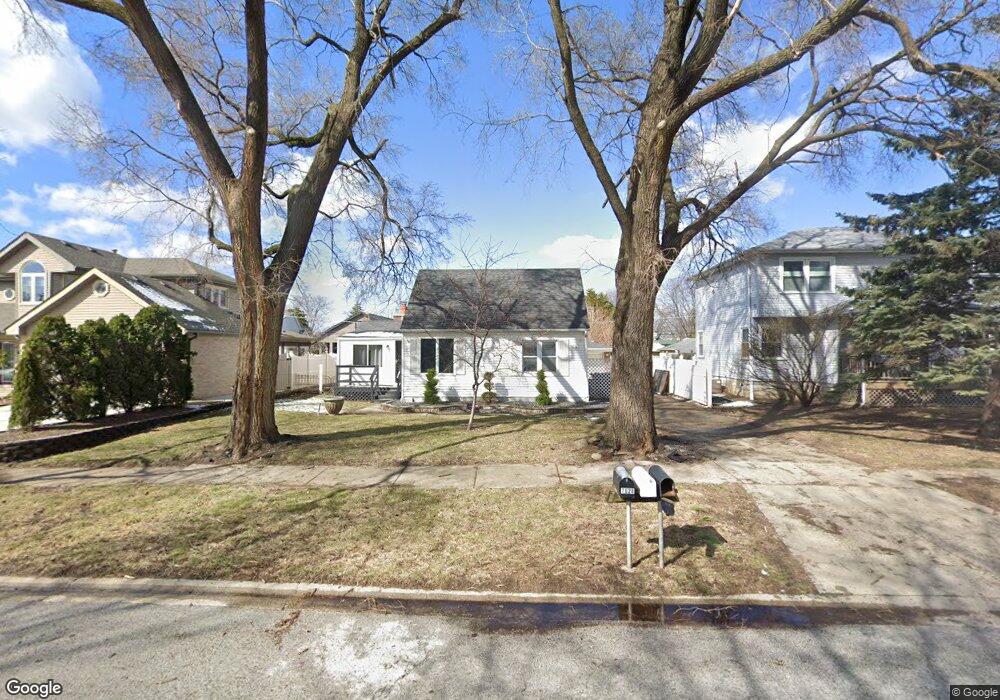
7028 W 96th St Oak Lawn, IL 60453
Estimated Value: $250,000 - $315,000
3
Beds
2
Baths
1,150
Sq Ft
$246/Sq Ft
Est. Value
About This Home
This home is located at 7028 W 96th St, Oak Lawn, IL 60453 and is currently estimated at $282,344, approximately $245 per square foot. 7028 W 96th St is a home located in Cook County with nearby schools including Ernest F Kolb Elementary School, Simmons Middle School, and Oak Lawn Community High School.
Ownership History
Date
Name
Owned For
Owner Type
Purchase Details
Closed on
Apr 28, 2017
Sold by
Katarzyna Rojewski Andrzej and Katarzyna Moszynska
Bought by
Paplawskas Paul
Current Estimated Value
Home Financials for this Owner
Home Financials are based on the most recent Mortgage that was taken out on this home.
Original Mortgage
$178,500
Outstanding Balance
$162,208
Interest Rate
8.25%
Mortgage Type
Adjustable Rate Mortgage/ARM
Estimated Equity
$120,136
Purchase Details
Closed on
Oct 22, 2003
Sold by
Rojewski Cyryla
Bought by
Rojewski Andrzel
Purchase Details
Closed on
Apr 28, 1995
Sold by
Worth Bank & Trust
Bought by
Rojewski Andrzej and Rojewski Cyryla
Home Financials for this Owner
Home Financials are based on the most recent Mortgage that was taken out on this home.
Original Mortgage
$92,250
Interest Rate
8.42%
Create a Home Valuation Report for This Property
The Home Valuation Report is an in-depth analysis detailing your home's value as well as a comparison with similar homes in the area
Home Values in the Area
Average Home Value in this Area
Purchase History
| Date | Buyer | Sale Price | Title Company |
|---|---|---|---|
| Paplawskas Paul | $210,000 | Stewart Title | |
| Rojewski Andrzel | -- | -- | |
| Rojewski Andrzej | $102,500 | -- |
Source: Public Records
Mortgage History
| Date | Status | Borrower | Loan Amount |
|---|---|---|---|
| Open | Paplawskas Paul | $178,500 | |
| Previous Owner | Rojewski Andrzej | $92,250 |
Source: Public Records
Tax History Compared to Growth
Tax History
| Year | Tax Paid | Tax Assessment Tax Assessment Total Assessment is a certain percentage of the fair market value that is determined by local assessors to be the total taxable value of land and additions on the property. | Land | Improvement |
|---|---|---|---|---|
| 2024 | $5,812 | $20,000 | $5,025 | $14,975 |
| 2023 | $5,589 | $20,000 | $5,025 | $14,975 |
| 2022 | $5,589 | $15,914 | $4,422 | $11,492 |
| 2021 | $5,416 | $15,914 | $4,422 | $11,492 |
| 2020 | $5,307 | $15,914 | $4,422 | $11,492 |
| 2019 | $5,001 | $15,404 | $4,020 | $11,384 |
| 2018 | $4,793 | $15,404 | $4,020 | $11,384 |
| 2017 | $3,795 | $15,404 | $4,020 | $11,384 |
| 2016 | $3,417 | $12,676 | $3,417 | $9,259 |
| 2015 | $3,349 | $12,676 | $3,417 | $9,259 |
| 2014 | $3,337 | $12,676 | $3,417 | $9,259 |
| 2013 | $3,619 | $14,663 | $3,417 | $11,246 |
Source: Public Records
Map
Nearby Homes
- 9708 Nottingham Ave Unit 9
- 9708 Nottingham Ave Unit 11
- 6913 97th St
- 9721 S Harlem Ave Unit 2C
- 7000 Mather Ave Unit 303
- 7000 Mather Ave Unit 101
- 9348 Sayre Ave
- 9812 Nottingham Ave Unit 14A
- 7110 W 93rd Place Unit PA
- 9829 Nottingham Ave Unit 10
- 9705 Oak Park Ave
- 9832 Nottingham Ave Unit 6
- 9832 Nottingham Ave Unit 5
- 6812 98th St
- 7100 99th St Unit 204
- 7048 Oconnell Dr Unit 2E
- 7048 Oconnell Dr Unit 3W
- 7125 Oconnell Dr Unit 102
- 9236 Stanford Dr
- 6634 W 95th St Unit 1D
- 7016 W 96th St
- 7036 W 96th St
- 7040 W 96th St
- 7006 W 96th St
- 7021 W 95th Place
- 7017 W 95th Place
- 7004 W 96th St
- 7053 W 95th Place
- 7013 W 95th Place
- 9555 Nottingham Ave
- 7015 W 96th St
- 7035 W 96th St
- 7035 W 96th St
- 7011 W 96th St
- 7009 W 95th Place
- 7057 W 95th Place
- 7037 W 96th St
- 7009 W 96th St
- 7002 W 96th St
- 7005 W 96th St