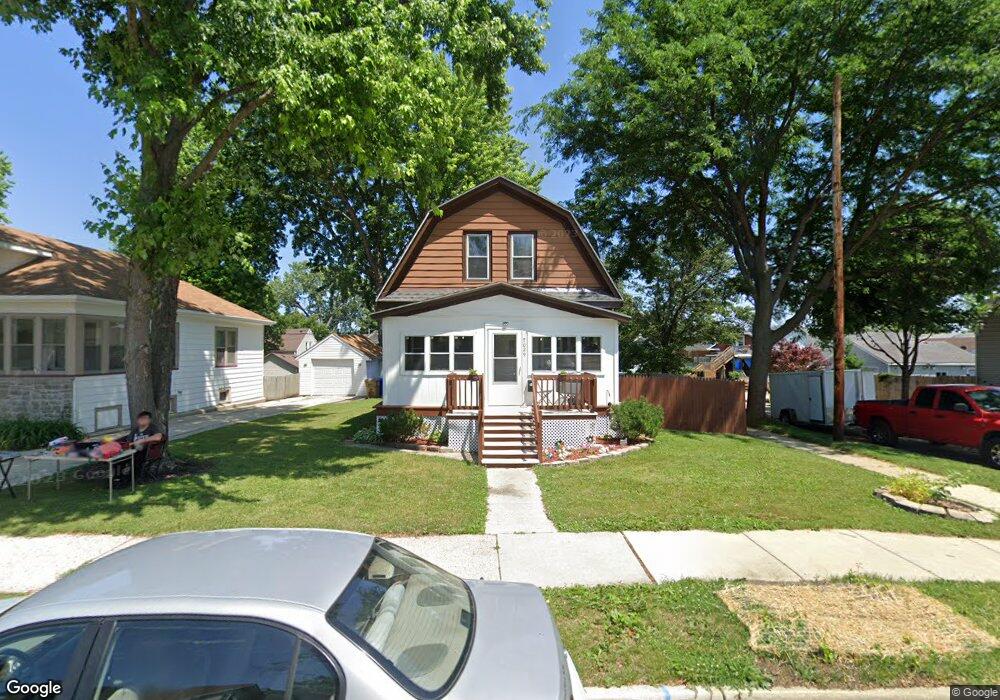
7029 38th Ave Kenosha, WI 53142
Roosevelt NeighborhoodEstimated Value: $180,000 - $224,000
3
Beds
1
Bath
1,188
Sq Ft
$170/Sq Ft
Est. Value
About This Home
This home is located at 7029 38th Ave, Kenosha, WI 53142 and is currently estimated at $201,895, approximately $169 per square foot. 7029 38th Ave is a home located in Kenosha County with nearby schools including Roosevelt Elementary School, Lincoln Middle School, and Indian Trail High School And Academy.
Ownership History
Date
Name
Owned For
Owner Type
Purchase Details
Closed on
Aug 21, 2015
Sold by
Molino Llc
Bought by
Gray Brandon S
Current Estimated Value
Home Financials for this Owner
Home Financials are based on the most recent Mortgage that was taken out on this home.
Original Mortgage
$82,968
Outstanding Balance
$66,806
Interest Rate
4.75%
Mortgage Type
FHA
Estimated Equity
$135,089
Purchase Details
Closed on
Jul 7, 2014
Sold by
Lapoint Bruce J
Bought by
Molino Llc
Create a Home Valuation Report for This Property
The Home Valuation Report is an in-depth analysis detailing your home's value as well as a comparison with similar homes in the area
Home Values in the Area
Average Home Value in this Area
Purchase History
| Date | Buyer | Sale Price | Title Company |
|---|---|---|---|
| Gray Brandon S | $84,500 | -- | |
| Molino Llc | $27,301 | -- |
Source: Public Records
Mortgage History
| Date | Status | Borrower | Loan Amount |
|---|---|---|---|
| Open | Gray Brandon S | $82,968 |
Source: Public Records
Tax History Compared to Growth
Tax History
| Year | Tax Paid | Tax Assessment Tax Assessment Total Assessment is a certain percentage of the fair market value that is determined by local assessors to be the total taxable value of land and additions on the property. | Land | Improvement |
|---|---|---|---|---|
| 2024 | $2,215 | $98,700 | $19,400 | $79,300 |
| 2023 | $2,215 | $98,700 | $19,400 | $79,300 |
| 2022 | $2,251 | $98,700 | $19,400 | $79,300 |
| 2021 | $2,300 | $98,700 | $19,400 | $79,300 |
| 2020 | $2,397 | $98,700 | $19,400 | $79,300 |
| 2019 | $2,297 | $98,700 | $19,400 | $79,300 |
| 2018 | $2,449 | $86,900 | $19,400 | $67,500 |
| 2017 | $2,207 | $86,900 | $19,400 | $67,500 |
| 2016 | $2,239 | $86,900 | $19,400 | $67,500 |
| 2015 | $2,128 | $82,400 | $21,400 | $61,000 |
| 2014 | $2,428 | $82,400 | $21,400 | $61,000 |
Source: Public Records
Map
Nearby Homes