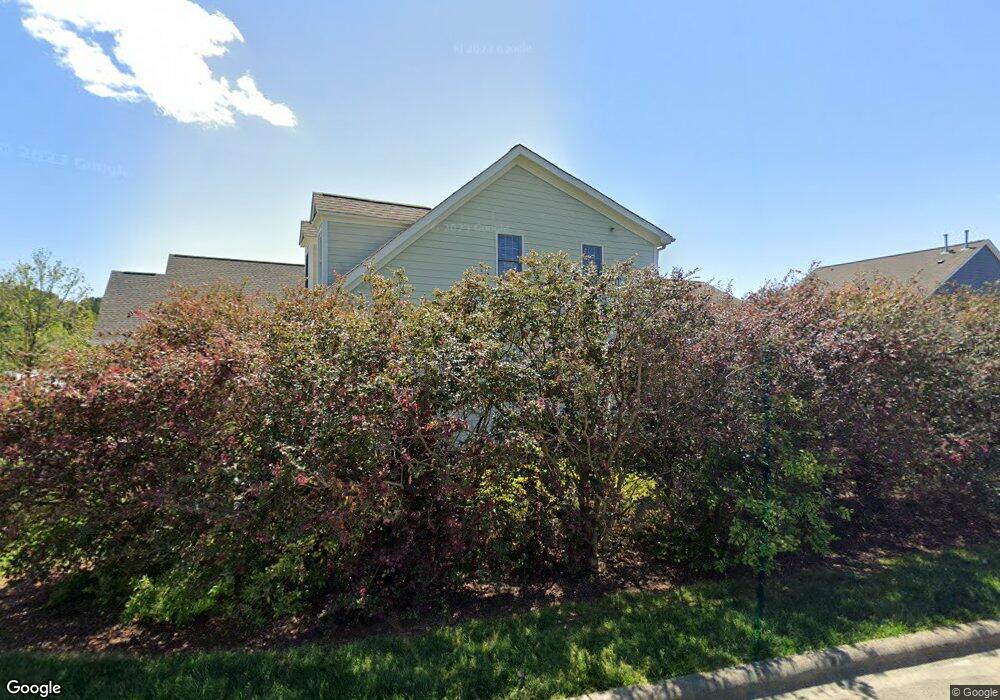
7029 Dayton Ridge Dr Unit L223 Apex, NC 27539
Middle Creek NeighborhoodEstimated Value: $481,000 - $517,000
3
Beds
3
Baths
1,775
Sq Ft
$280/Sq Ft
Est. Value
About This Home
This home is located at 7029 Dayton Ridge Dr Unit L223, Apex, NC 27539 and is currently estimated at $497,727, approximately $280 per square foot. 7029 Dayton Ridge Dr Unit L223 is a home located in Wake County with nearby schools including West Lake Elementary School, West Lake Middle, and Middle Creek High.
Ownership History
Date
Name
Owned For
Owner Type
Purchase Details
Closed on
May 26, 2023
Sold by
Deholguln Rosario Ernestjnaausejo Pena
Bought by
Young Michelle Lynn
Current Estimated Value
Home Financials for this Owner
Home Financials are based on the most recent Mortgage that was taken out on this home.
Original Mortgage
$305,200
Outstanding Balance
$297,039
Interest Rate
6.39%
Mortgage Type
New Conventional
Estimated Equity
$200,688
Purchase Details
Closed on
May 19, 2014
Sold by
Graff Benjamin E and Graff Caroline C
Bought by
Deholguin Rosario Ernestina Ausejo Pe
Purchase Details
Closed on
Feb 12, 2009
Sold by
L & L Of Raleigh Inc
Bought by
Graff Benjamin and Graff Caroline C
Home Financials for this Owner
Home Financials are based on the most recent Mortgage that was taken out on this home.
Original Mortgage
$225,400
Interest Rate
4.25%
Mortgage Type
Purchase Money Mortgage
Create a Home Valuation Report for This Property
The Home Valuation Report is an in-depth analysis detailing your home's value as well as a comparison with similar homes in the area
Home Values in the Area
Average Home Value in this Area
Purchase History
| Date | Buyer | Sale Price | Title Company |
|---|---|---|---|
| Young Michelle Lynn | $436,000 | None Listed On Document | |
| Deholguin Rosario Ernestina Ausejo Pe | $245,000 | None Available | |
| Graff Benjamin | $225,500 | None Available |
Source: Public Records
Mortgage History
| Date | Status | Borrower | Loan Amount |
|---|---|---|---|
| Open | Young Michelle Lynn | $305,200 | |
| Previous Owner | Graff Benjamin | $225,400 |
Source: Public Records
Tax History Compared to Growth
Tax History
| Year | Tax Paid | Tax Assessment Tax Assessment Total Assessment is a certain percentage of the fair market value that is determined by local assessors to be the total taxable value of land and additions on the property. | Land | Improvement |
|---|---|---|---|---|
| 2025 | $4,141 | $480,788 | $120,000 | $360,788 |
| 2024 | $4,051 | $480,788 | $120,000 | $360,788 |
| 2023 | $3,134 | $310,767 | $65,000 | $245,767 |
| 2022 | $3,017 | $310,767 | $65,000 | $245,767 |
| 2021 | $2,957 | $310,767 | $65,000 | $245,767 |
| 2020 | $2,972 | $310,767 | $65,000 | $245,767 |
| 2019 | $2,735 | $253,535 | $56,000 | $197,535 |
| 2018 | $2,567 | $253,535 | $56,000 | $197,535 |
| 2017 | $2,467 | $253,535 | $56,000 | $197,535 |
| 2016 | $2,430 | $253,535 | $56,000 | $197,535 |
| 2015 | $2,556 | $257,642 | $44,000 | $213,642 |
| 2014 | -- | $257,642 | $44,000 | $213,642 |
Source: Public Records
Map
Nearby Homes
- 7404 Bedford Ridge Dr
- 6025 Larboard Dr
- 333 Calvander Ln
- 120 Corapeake Way
- 124 Corapeake Way
- 128 Corapeake Way
- 104 Corapeake Way
- 5340 Serene Forest Dr
- 8401 Piney Branch Dr
- 409 Wanderview Ln
- 5045 Homeplace Dr
- 112 Skygrove Dr
- 804 Blue Thorn Dr
- 113 Middlegreen Place
- 129 Middlegreen Place
- 204 Edgepine Dr
- 436 Edgepine Dr
- 3601 Lebrun Path Unit 26 Eldorado Cr
- 3408 Sawyers Mill Dr
- 3101 Sawyers Mill Dr
- 7029 Dayton Ridge Dr
- 7025 Dayton Ridge Dr Unit L224
- 7021 Dayton Ridge Dr
- 7021 Dayton Ridge Dr Unit L225
- 7037 Dayton Ridge Dr
- 7037 Dayton Ridge Dr Unit L222
- 7105 Hinman Ln
- 7101 Hinman Ln
- 7109 Hinman Ln
- 7017 Dayton Ridge Dr
- 7017 Dayton Ridge Dr Unit L226
- 7041 Dayton Ridge Dr
- 7041 Dayton Ridge Dr Unit L 221
- 7113 Hinman Ln
- 7032 Dayton Ridge Dr
- 7028 Dayton Ridge Dr
- 7036 Dayton Ridge Dr
- 5208 Maplechase Ln
- 7024 Dayton Ridge Dr
- 7040 Dayton Ridge Dr