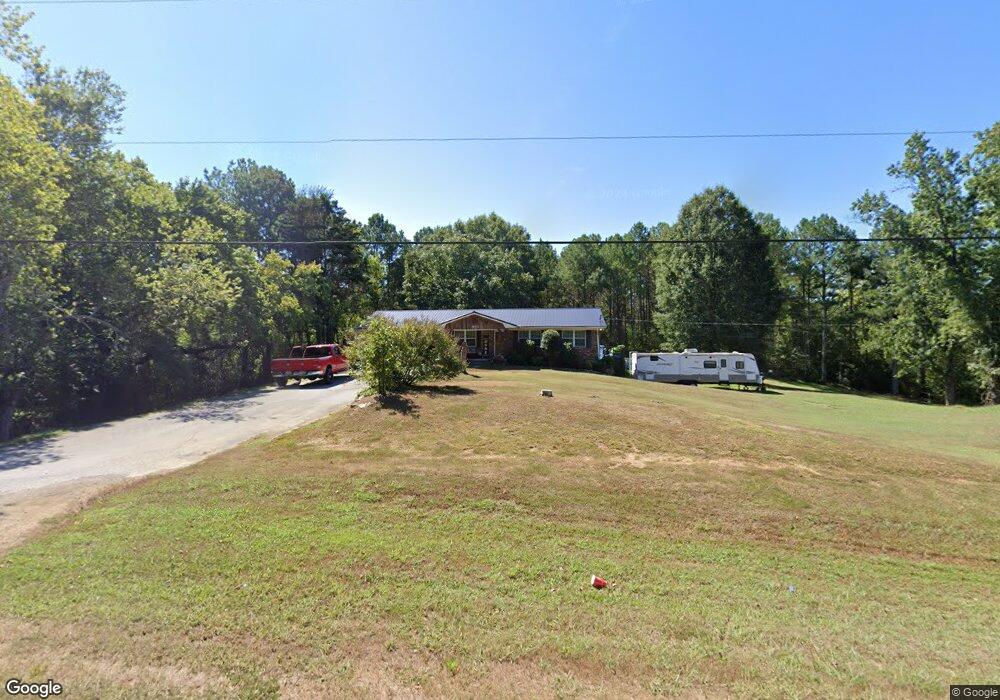
7029 Red Bud Rd NE Ranger, GA 30734
Estimated Value: $226,085 - $340,000
3
Beds
1
Bath
1,408
Sq Ft
$198/Sq Ft
Est. Value
About This Home
This home is located at 7029 Red Bud Rd NE, Ranger, GA 30734 and is currently estimated at $278,271, approximately $197 per square foot. 7029 Red Bud Rd NE is a home located in Gordon County with nearby schools including Fairmount Elementary School, Red Bud Middle School, and Sonoraville High School.
Ownership History
Date
Name
Owned For
Owner Type
Purchase Details
Closed on
Jan 4, 2017
Sold by
Cantrell Steve
Bought by
Nicholson Jeffery
Current Estimated Value
Home Financials for this Owner
Home Financials are based on the most recent Mortgage that was taken out on this home.
Original Mortgage
$127,645
Outstanding Balance
$106,492
Interest Rate
4.13%
Mortgage Type
FHA
Estimated Equity
$174,581
Purchase Details
Closed on
Apr 19, 1988
Bought by
Cantrell Steve
Create a Home Valuation Report for This Property
The Home Valuation Report is an in-depth analysis detailing your home's value as well as a comparison with similar homes in the area
Home Values in the Area
Average Home Value in this Area
Purchase History
| Date | Buyer | Sale Price | Title Company |
|---|---|---|---|
| Nicholson Jeffery | $130,000 | -- | |
| Cantrell Steve | -- | -- |
Source: Public Records
Mortgage History
| Date | Status | Borrower | Loan Amount |
|---|---|---|---|
| Open | Nicholson Jeffery | $127,645 | |
| Previous Owner | Cantrell Steve | $0 |
Source: Public Records
Tax History Compared to Growth
Tax History
| Year | Tax Paid | Tax Assessment Tax Assessment Total Assessment is a certain percentage of the fair market value that is determined by local assessors to be the total taxable value of land and additions on the property. | Land | Improvement |
|---|---|---|---|---|
| 2024 | $736 | $55,160 | $32,280 | $22,880 |
| 2023 | $699 | $53,840 | $32,280 | $21,560 |
| 2022 | $710 | $52,720 | $32,280 | $20,440 |
| 2021 | $572 | $46,952 | $32,280 | $14,672 |
| 2020 | $569 | $47,348 | $32,320 | $15,028 |
| 2019 | $566 | $47,348 | $32,320 | $15,028 |
| 2018 | $536 | $46,508 | $32,320 | $14,188 |
| 2017 | $577 | $37,028 | $23,800 | $13,228 |
| 2016 | $514 | $37,028 | $23,800 | $13,228 |
| 2015 | $498 | $36,708 | $23,800 | $12,908 |
| 2014 | $465 | $36,089 | $23,824 | $12,264 |
Source: Public Records
Map
Nearby Homes
- 7169 Red Bud Rd NE
- 0 Redbud Rd NE Unit 9625 20137379
- 0 Hightower Loop NE Unit 9628-D 20178374
- 0 Hightower Loop NE Unit 9628-C 20178372
- 191 Hightower Loop NE
- 0 Lick Creek Rd NE Unit 9624-5 10586585
- 0 Lick Creek Rd NE Unit 9624-C 20007654
- 7596 Red Bud Rd NE
- 1031 Langford Rd NE
- 191 Langford Rd NE
- 1192 Pleasant Hill Rd NE
- 0 Old Oakman Rd NE Unit 9628-A 20178369
- 0 Red Bone Ridge Rd SE Unit 9616 20125600
- 0 T Johnson Rd NE Unit 9631-F 20083625
- 0 T Johnson Rd NE Unit 9631-A 20083603
- 1488 Pleasant Hill Rd NE
- 956 Liberty Church Rd NE
- 0 Lovebridge Rd SE
- 1009 Liberty Church Rd NE
- 1001 Liberty Church Rd NE
- 7029 Red Bud Rd NE
- 6975 Red Bud Rd NE
- 6968 Red Bud Rd NE
- 7079 Red Bud Rd NE
- 0 Red Bud Rd NE Unit 5993940
- 0 Red Bud Rd NE Unit 5892534
- 0 Red Bud Rd NE Unit 179 7016376
- 0 Red Bud Rd NE Unit 179 7210580
- 0 Red Bud Rd NE Unit 179 7396610
- 28 Red Bud Rd NE
- 0 Red Bud Rd NE
- 00 Red Bud Rd NE
- 0 Red Bud Rd NE Unit 10141817
- 0 Red Bud Rd NE Unit 7186804
- 0 Red Bud Rd NE Unit 10052600
- 0 Red Bud Rd NE Unit 7052959
- 0 Red Bud Rd NE Unit 10015691
- 0 Red Bud Rd NE Unit 6992874
- 0 Red Bud Rd NE Unit 7062617
- 0 Red Bud Rd NE Unit 7507047