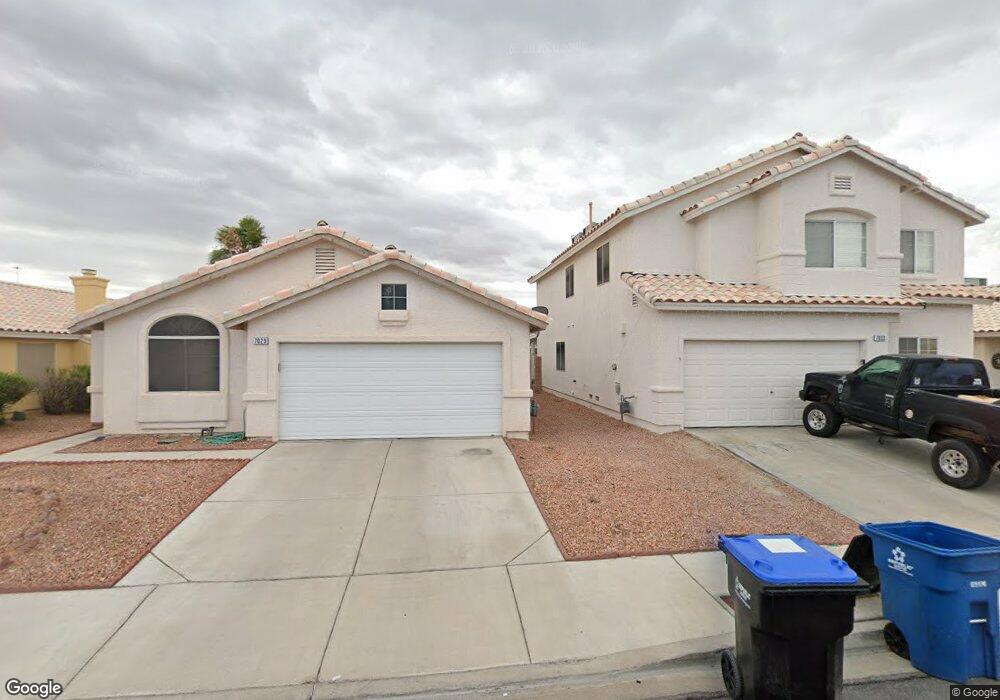
7029 Village Shore Ct Las Vegas, NV 89129
Lone Mountain NeighborhoodEstimated Value: $383,935 - $416,000
3
Beds
2
Baths
1,565
Sq Ft
$257/Sq Ft
Est. Value
About This Home
This home is located at 7029 Village Shore Ct, Las Vegas, NV 89129 and is currently estimated at $401,984, approximately $256 per square foot. 7029 Village Shore Ct is a home located in Clark County with nearby schools including Ruthe Deskin Elementary School, Justice Myron E Leavitt Middle School, and Centennial High School.
Ownership History
Date
Name
Owned For
Owner Type
Purchase Details
Closed on
Nov 6, 1996
Sold by
Relocation Closing Services Inc
Bought by
Sperduti Natale and Sperduti Gloria
Current Estimated Value
Home Financials for this Owner
Home Financials are based on the most recent Mortgage that was taken out on this home.
Original Mortgage
$88,500
Outstanding Balance
$8,699
Interest Rate
8.06%
Estimated Equity
$393,285
Purchase Details
Closed on
Oct 24, 1996
Sold by
Steffes Mark E and Steffes Lori K
Bought by
Relocation Closing Services Inc
Home Financials for this Owner
Home Financials are based on the most recent Mortgage that was taken out on this home.
Original Mortgage
$88,500
Outstanding Balance
$8,699
Interest Rate
8.06%
Estimated Equity
$393,285
Purchase Details
Closed on
Mar 24, 1995
Sold by
Mvl Inc
Bought by
Steffes Mark E and Steffes Lori K
Home Financials for this Owner
Home Financials are based on the most recent Mortgage that was taken out on this home.
Original Mortgage
$114,622
Interest Rate
8.86%
Mortgage Type
FHA
Create a Home Valuation Report for This Property
The Home Valuation Report is an in-depth analysis detailing your home's value as well as a comparison with similar homes in the area
Home Values in the Area
Average Home Value in this Area
Purchase History
| Date | Buyer | Sale Price | Title Company |
|---|---|---|---|
| Sperduti Natale | -- | Fidelity National Title | |
| Relocation Closing Services Inc | $118,000 | Fidelity National Title | |
| Steffes Mark E | $117,000 | First American Title Company |
Source: Public Records
Mortgage History
| Date | Status | Borrower | Loan Amount |
|---|---|---|---|
| Open | Sperduti Natale | $88,500 | |
| Previous Owner | Steffes Mark E | $114,622 |
Source: Public Records
Tax History Compared to Growth
Tax History
| Year | Tax Paid | Tax Assessment Tax Assessment Total Assessment is a certain percentage of the fair market value that is determined by local assessors to be the total taxable value of land and additions on the property. | Land | Improvement |
|---|---|---|---|---|
| 2025 | $1,606 | $81,471 | $30,450 | $51,021 |
| 2024 | $1,560 | $81,471 | $30,450 | $51,021 |
| 2023 | $1,560 | $78,117 | $29,400 | $48,717 |
| 2022 | $1,514 | $68,329 | $23,800 | $44,529 |
| 2021 | $1,470 | $63,533 | $21,000 | $42,533 |
| 2020 | $1,425 | $62,634 | $20,300 | $42,334 |
| 2019 | $1,383 | $60,445 | $18,550 | $41,895 |
| 2018 | $1,343 | $55,325 | $15,050 | $40,275 |
| 2017 | $1,785 | $54,464 | $13,650 | $40,814 |
| 2016 | $1,273 | $50,360 | $9,100 | $41,260 |
| 2015 | $1,269 | $42,368 | $8,050 | $34,318 |
| 2014 | $1,232 | $36,499 | $7,000 | $29,499 |
Source: Public Records
Map
Nearby Homes
- 7132 Junction Village Ave
- 7029 Desert Clover Ct
- 7016 Desert Clover Ct
- 4810 Black Bear Rd Unit 202
- 4800 Grey Wolf Ln Unit 202
- 4811 Black Bear Rd Unit 201
- 4810 Grey Wolf Ln Unit 101
- 4821 Black Bear Rd Unit 203
- 4901 Portraits Place
- 4920 Black Bear Rd Unit 204
- 4941 Black Bear Rd Unit 202
- 5009 Forest Oaks Dr
- 7433 Alice Springs Cir
- 3344 Dancing Waters St
- 3350 Dancing Waters St
- 3351 Dancing Waters St
- 4412 N Pioneer Way
- 6636 Painted Desert Dr
- 4885 N Pioneer Way
- 5024 Saint Annes Dr
- 7025 Village Shore Ct
- 7033 Village Shore Ct
- 7021 Village Shore Ct
- 7037 Village Shore Ct
- 7024 Junction Village Ave
- 7020 Junction Village Ave
- 7028 Junction Village Ave
- 7016 Junction Village Ave
- 7013 Village Shore Ct Unit 2
- 7032 Junction Village Ave
- 7041 Village Shore Ct Unit 2
- 7028 Village Shore Ct
- 7024 Village Shore Ct
- 7032 Village Shore Ct
- 7012 Junction Village Ave
- 7020 Village Shore Ct
- 7036 Junction Village Ave
- 7009 Village Shore Ct
- 7036 Village Shore Ct
- 7016 Village Shore Ct