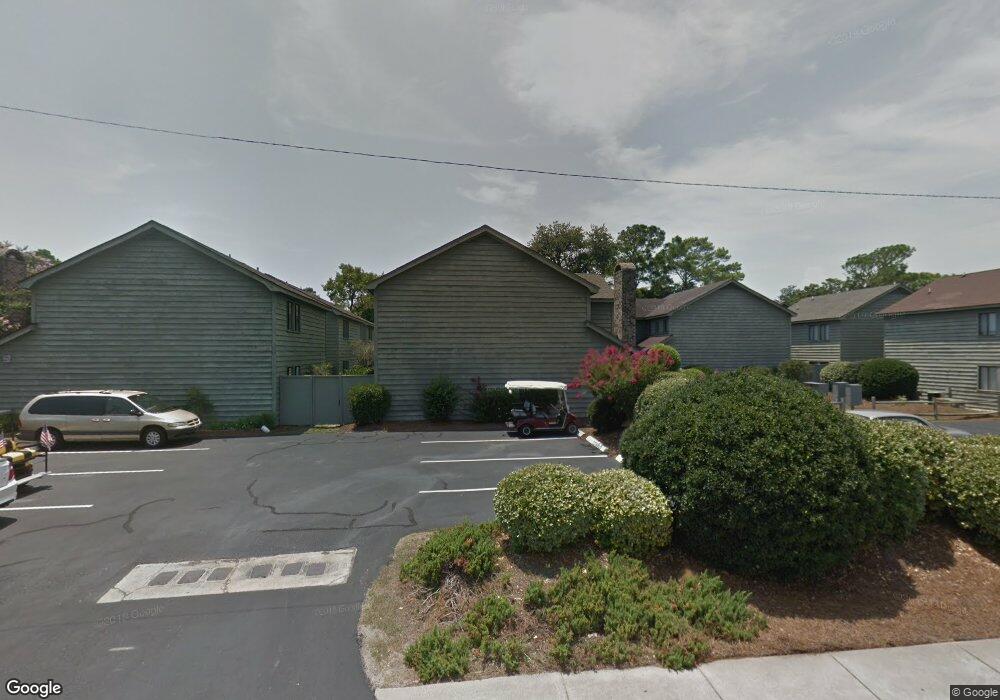
703 11th Ave S Unit C North Myrtle Beach, SC 29582
Crescent Beach NeighborhoodEstimated Value: $380,000 - $410,000
3
Beds
2
Baths
1,648
Sq Ft
$241/Sq Ft
Est. Value
About This Home
This home is located at 703 11th Ave S Unit C, North Myrtle Beach, SC 29582 and is currently estimated at $396,544, approximately $240 per square foot. 703 11th Ave S Unit C is a home located in Horry County with nearby schools including Ocean Drive Elementary School, North Myrtle Beach Middle School, and North Myrtle Beach High School.
Ownership History
Date
Name
Owned For
Owner Type
Purchase Details
Closed on
Aug 1, 2011
Sold by
Freeman Rachel Gibson
Bought by
Freeman Earl Wayne
Current Estimated Value
Purchase Details
Closed on
Mar 19, 2009
Sold by
Freeman Earl Wayne
Bought by
Freeman Rachel Gibson
Purchase Details
Closed on
Feb 22, 2007
Sold by
Eplin Donald R
Bought by
Gibson Freeman Sr Earl Wayne and Gibson Freeman Rachel
Purchase Details
Closed on
Nov 22, 2004
Sold by
Ingram Place Homeowners Assn Inc
Bought by
South Carolina Electric & Gas Co
Purchase Details
Closed on
Feb 28, 2002
Sold by
Harris David A
Bought by
Eplin Donald R
Home Financials for this Owner
Home Financials are based on the most recent Mortgage that was taken out on this home.
Original Mortgage
$79,000
Interest Rate
6.98%
Mortgage Type
Purchase Money Mortgage
Create a Home Valuation Report for This Property
The Home Valuation Report is an in-depth analysis detailing your home's value as well as a comparison with similar homes in the area
Home Values in the Area
Average Home Value in this Area
Purchase History
| Date | Buyer | Sale Price | Title Company |
|---|---|---|---|
| Freeman Earl Wayne | -- | -- | |
| Freeman Rachel Gibson | -- | -- | |
| Gibson Freeman Sr Earl Wayne | $240,000 | None Available | |
| South Carolina Electric & Gas Co | -- | -- | |
| Eplin Donald R | $109,000 | -- |
Source: Public Records
Mortgage History
| Date | Status | Borrower | Loan Amount |
|---|---|---|---|
| Previous Owner | Eplin Donald R | $79,000 |
Source: Public Records
Tax History Compared to Growth
Tax History
| Year | Tax Paid | Tax Assessment Tax Assessment Total Assessment is a certain percentage of the fair market value that is determined by local assessors to be the total taxable value of land and additions on the property. | Land | Improvement |
|---|---|---|---|---|
| 2024 | $1,491 | $15,923 | $9,000 | $6,923 |
| 2023 | $1,491 | $11,111 | $3,618 | $7,493 |
| 2021 | $802 | $12,127 | $3,895 | $8,232 |
| 2020 | $2,486 | $12,127 | $3,895 | $8,232 |
| 2019 | $2,399 | $12,127 | $3,895 | $8,232 |
| 2018 | $0 | $9,662 | $3,146 | $6,516 |
| 2017 | $0 | $9,662 | $3,146 | $6,516 |
| 2016 | $0 | $9,662 | $3,146 | $6,516 |
| 2015 | -- | $9,662 | $3,146 | $6,516 |
| 2014 | $2,102 | $9,662 | $3,146 | $6,516 |
Source: Public Records
Map
Nearby Homes
- 705 11th Ave S Unit B
- 802 12th Ave S Unit Lot 10
- 701 11th Ave S Unit 3D
- 804 12th Ave S Unit 218
- 1004 Edge Dr Unit J
- 1004 Edge Dr Unit H
- 931 Edge Dr
- 927 Edge Dr
- 934 Tiffany Ln
- 829 9th Ave S Unit 8
- 829 9th Ave S Unit 12
- 829 9th Ave S Unit 65
- 1000 Strand Ave
- 908 Tiffany Ln
- 2307 Hillside Dr S Unit Lot 15 Block 40, Cre
- 2305 Hillside Dr S Unit Crescent Section,Lot
- 1010 Perrin Dr Unit Q
- 1002 Perrin Dr
- 914 Hillside Dr S Unit T
- 814 Belle Dr
- 703 11th Ave S
- 703 11th Ave S Unit E
- 703 11th Ave S Unit B
- 703 11th Ave S Unit D
- 703 11th Ave S Unit A
- 703 11th Ave S Unit 703-C Ingram Pl
- 704 12th Ave S
- 705 11th Ave S
- 705 11th Ave S Unit E
- 705 11th Ave S
- 705 11th Ave S
- 705 11th Ave S
- 705 11th Ave S
- 705 11th Ave S Unit A
- 705 11th Ave S Unit 705 C
- 705 11th Ave S Unit Ingram Place-North M
- 705 11th Ave S Unit F
- 705 11th Ave S Unit A
- 705C 11th Ave S
- 708 12th Ave S