703 11th St NE East Wenatchee, WA 98802
Estimated Value: $506,000 - $677,000
About This Home
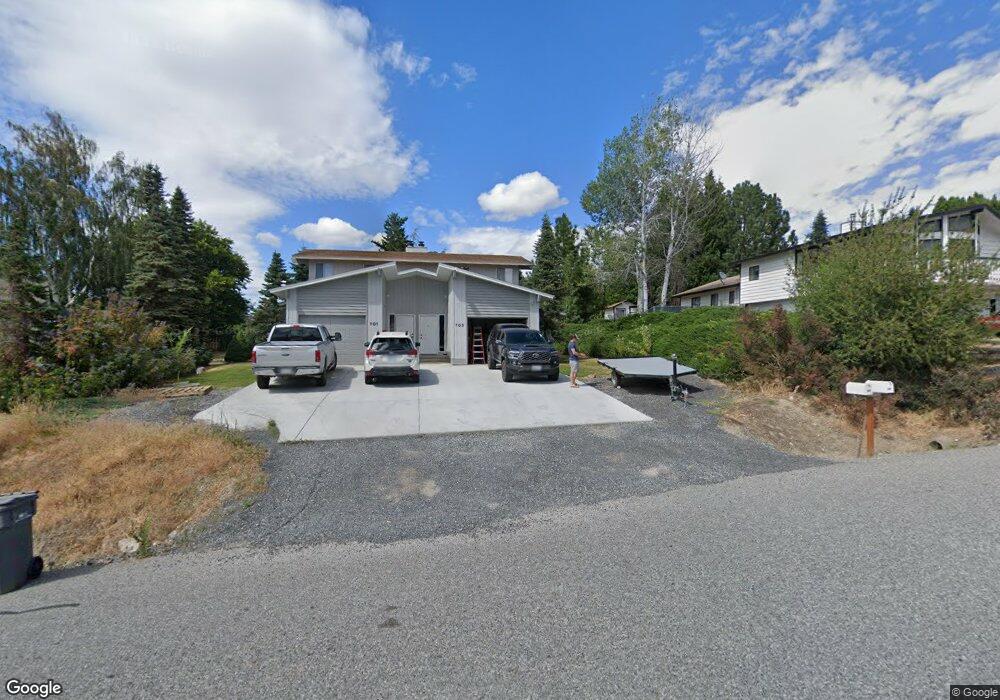
The unit is comprised of 2 bedrooms and 1 bathroom on the second floor with the living, dining and kitchen on the first floor with a washer and dryer in the laundry closet. The master bedroom has a large closet and a balcony for quiet moments. The second bedroom is also good sized with a larger closet. Downstairs the living room opens to a semi-private, shared yard with a small patio. Single car garage has extra room for storage and opens to the kitchen for easy access.
Eastmont School District
No Smoking on the Property
No Pets
1 Year Lease
$100 for water and sewer
Lawn mowing inlcuded
Tenant pays for electricity and garbage
**Renters Insurance Required**
Information deemed reliable, but not guaranteed
For more information or to schedule a showing, please call our office.
Office Location:
A & M Properties
412-D N. Mission Street
Wenatchee, WA
Ownership History
Purchase Details
Home Financials for this Owner
Home Financials are based on the most recent Mortgage that was taken out on this home.Home Values in the Area
Average Home Value in this Area
Purchase History
| Date | Buyer | Sale Price | Title Company |
|---|---|---|---|
| Bachler Lance | -- | Pioneer Title |
Mortgage History
| Date | Status | Borrower | Loan Amount |
|---|---|---|---|
| Open | Bachler Lance | $341,250 |
Property History
| Date | Event | Price | List to Sale | Price per Sq Ft |
|---|---|---|---|---|
| 08/28/2024 08/28/24 | For Rent | $1,850 | -- | -- |
Tax History Compared to Growth
Tax History
| Year | Tax Paid | Tax Assessment Tax Assessment Total Assessment is a certain percentage of the fair market value that is determined by local assessors to be the total taxable value of land and additions on the property. | Land | Improvement |
|---|---|---|---|---|
| 2025 | $3,926 | $467,800 | $100,000 | $367,800 |
| 2024 | $3,926 | $467,800 | $100,000 | $367,800 |
| 2023 | $4,252 | $437,400 | $100,000 | $337,400 |
| 2022 | $3,879 | $369,200 | $80,000 | $289,200 |
| 2021 | $3,496 | $369,200 | $80,000 | $289,200 |
| 2020 | $3,350 | $306,200 | $72,000 | $234,200 |
| 2018 | $3,112 | $267,600 | $60,000 | $207,600 |
| 2017 | $2,668 | $267,600 | $60,000 | $207,600 |
| 2016 | $2,094 | $248,700 | $60,000 | $188,700 |
| 2015 | $2,184 | $187,700 | $60,000 | $127,700 |
| 2014 | -- | $187,700 | $60,000 | $127,700 |
| 2013 | -- | $187,700 | $60,000 | $127,700 |
Map
- 1352 Eastmont Ave Unit 15
- 520 11th St NE Unit 21
- 1494 Eastmont Ave Unit 56
- 1494 Eastmont Ave Unit 33
- 1494 Eastmont Ave Unit 58
- 1055 N Jackson Ave
- 1046 Corum Cir
- 845 N Devon Ave
- 646 N Gale Place
- 1653 Holly Ln
- 946 Briarwood Dr
- 1051 N Baker Ave Unit A-202
- 1051 N Baker Ave Unit A102
- 1051 N Baker Ave Unit B 203
- 1218 N Ashland Ave
- 544 N Colorado Ave
- 3234 NW Chadwick (Lot 25) Loop
- 902 N Kenroy Terrace
- 1840 Country Club Dr
- 1992 Stoneridge Dr