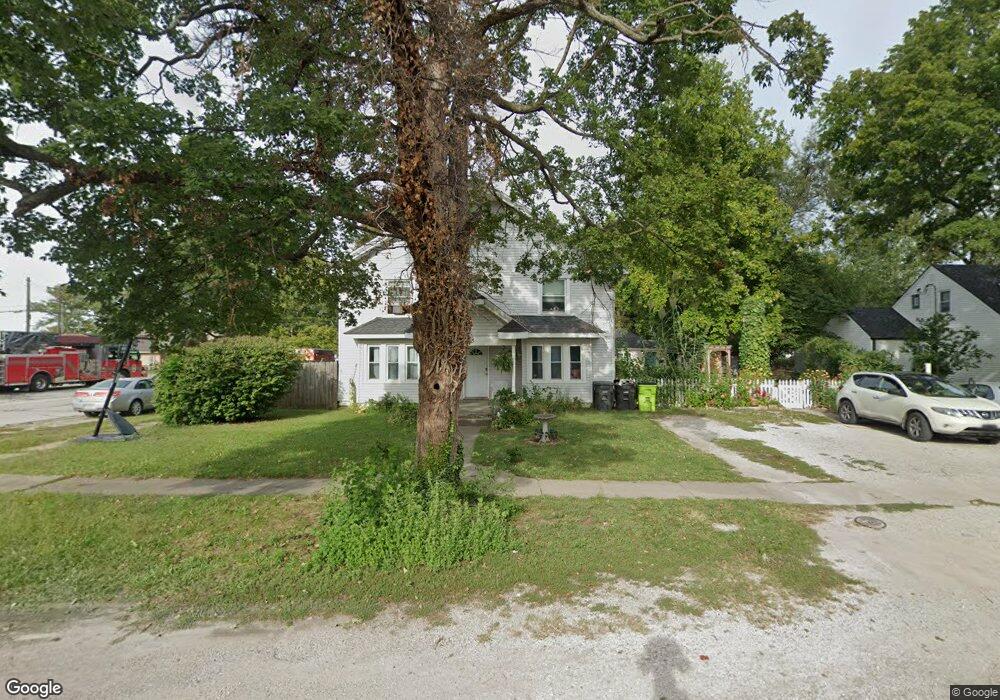
703 2nd St Belton, MO 64012
Estimated Value: $223,795 - $317,000
About This Home
This home is located at 703 2nd St, Belton, MO 64012 and is currently estimated at $262,199, approximately $116 per square foot. 703 2nd St is a home located in Cass County with nearby schools including Scott Elementary School, Belton Middle School, and Mill Creek Upper Elementary School.
Ownership History
We collect this data history from publicly available records. To have your information removed, we recommend requesting removal directly through your county’s website.
Purchase Details
Home Financials for this Owner
Home Financials are based on the most recent Mortgage that was taken out on this home.Home Values in the Area
Average Home Value in this Area
Purchase History
We collect this data history from publicly available records. To have your information removed, we recommend requesting removal directly through your county’s website.
| Date | Buyer | Sale Price | Title Company |
|---|---|---|---|
| -- | Coffelt Land Title |
Mortgage History
We collect this data history from publicly available records. To have your information removed, we recommend requesting removal directly through your county’s website.
| Date | Status | Borrower | Loan Amount |
|---|---|---|---|
| Open | $98,188 |
Tax History
We collect this data history from publicly available records. To have your information removed, we recommend requesting removal directly through your county’s website.
| Year | Tax Paid | Tax Assessment Tax Assessment Total Assessment is a certain percentage of the fair market value that is determined by local assessors to be the total taxable value of land and additions on the property. | Land | Improvement |
|---|---|---|---|---|
| 2025 | $1,620 | $22,600 | $1,670 | $20,930 |
| 2024 | $1,620 | $19,650 | $1,520 | $18,130 |
| 2023 | $1,616 | $19,650 | $1,520 | $18,130 |
| 2022 | $1,449 | $17,460 | $1,520 | $15,940 |
| 2021 | $1,449 | $17,460 | $1,520 | $15,940 |
| 2020 | $1,340 | $16,050 | $1,520 | $14,530 |
| 2019 | $1,312 | $16,050 | $1,520 | $14,530 |
| 2018 | $1,167 | $14,400 | $1,220 | $13,180 |
| 2017 | $1,119 | $14,400 | $1,220 | $13,180 |
| 2016 | $1,119 | $13,730 | $1,220 | $12,510 |
| 2015 | $1,119 | $13,730 | $1,220 | $12,510 |
| 2014 | $1,123 | $13,730 | $1,220 | $12,510 |
| 2013 | -- | $13,730 | $1,220 | $12,510 |
Map
- 120 E South Ave
- 501 Maier Dr Unit 503
- 410 B St
- 704 S Cedar St
- 723 Connor St
- 708 Autumn Dr
- 513 Bud Ln
- 519 Coleman Dr
- 709 Hollis Ave
- 118 Nanette St
- 710 Solstice Cir
- 717 Solstice Cir
- 702 Solstice Cir
- 205 Apple Valley Pkwy
- 714 Solstice Cir
- 706 Solstice Cir
- 821 Heather Dr
- 721 Solstice Cir
- 713 Solstice Cir
- 815 Autumn Dr
Ask me questions while you tour the home.