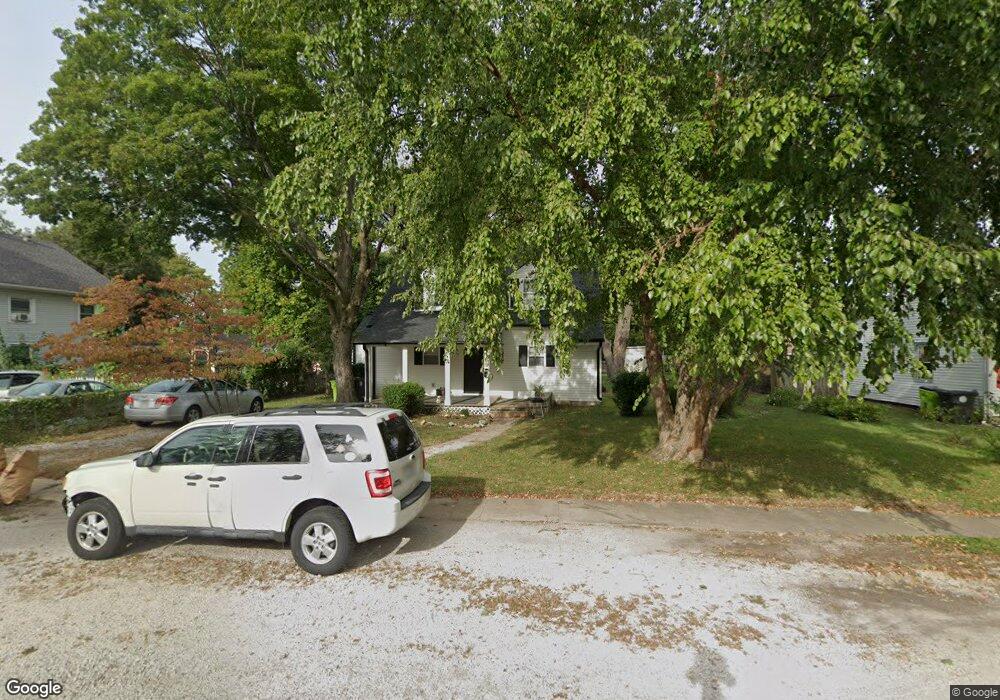
711 2nd St Belton, MO 64012
Estimated Value: $221,712 - $296,000
3
Beds
2
Baths
2,187
Sq Ft
$118/Sq Ft
Est. Value
About This Home
This home is located at 711 2nd St, Belton, MO 64012 and is currently estimated at $257,178, approximately $117 per square foot. 711 2nd St is a home located in Cass County with nearby schools including Scott Elementary School, Belton Middle School, and Mill Creek Upper Elementary School.
Ownership History
Date
Name
Owned For
Owner Type
Purchase Details
Closed on
Jul 12, 2017
Sold by
Kelley Rita B
Bought by
Pruter Tara
Current Estimated Value
Home Financials for this Owner
Home Financials are based on the most recent Mortgage that was taken out on this home.
Original Mortgage
$104,570
Outstanding Balance
$86,579
Interest Rate
3.94%
Mortgage Type
FHA
Estimated Equity
$170,599
Create a Home Valuation Report for This Property
The Home Valuation Report is an in-depth analysis detailing your home's value as well as a comparison with similar homes in the area
Home Values in the Area
Average Home Value in this Area
Purchase History
We collect this data history from publicly available records. To have your information removed, we recommend requesting removal directly through your county’s website.
| Date | Buyer | Sale Price | Title Company |
|---|---|---|---|
| Pruter Tara | -- | Chicago Title |
Source: Public Records
Mortgage History
We collect this data history from publicly available records. To have your information removed, we recommend requesting removal directly through your county’s website.
| Date | Status | Borrower | Loan Amount |
|---|---|---|---|
| Open | Pruter Tara | $104,570 |
Source: Public Records
Tax History
| Year | Tax Paid | Tax Assessment Tax Assessment Total Assessment is a certain percentage of the fair market value that is determined by local assessors to be the total taxable value of land and additions on the property. | Land | Improvement |
|---|---|---|---|---|
| 2025 | $1,698 | $23,720 | $2,460 | $21,260 |
| 2024 | $1,698 | $20,600 | $2,240 | $18,360 |
| 2023 | $1,694 | $20,600 | $2,240 | $18,360 |
| 2022 | $1,518 | $18,290 | $2,240 | $16,050 |
| 2021 | $1,518 | $18,290 | $2,240 | $16,050 |
| 2020 | $1,259 | $15,080 | $2,240 | $12,840 |
| 2019 | $1,233 | $15,080 | $2,240 | $12,840 |
| 2018 | $1,088 | $13,420 | $1,790 | $11,630 |
| 2017 | $1,044 | $13,420 | $1,790 | $11,630 |
| 2016 | $1,044 | $12,810 | $1,790 | $11,020 |
| 2015 | $1,044 | $12,810 | $1,790 | $11,020 |
| 2014 | $1,047 | $12,810 | $1,790 | $11,020 |
| 2013 | -- | $12,810 | $1,790 | $11,020 |
Source: Public Records
Map
Nearby Homes
Your Personal Tour Guide
Ask me questions while you tour the home.