703 5th St Charleroi, PA 15022
Estimated Value: $63,000 - $99,000
3
Beds
3
Baths
1,896
Sq Ft
$46/Sq Ft
Est. Value
About This Home
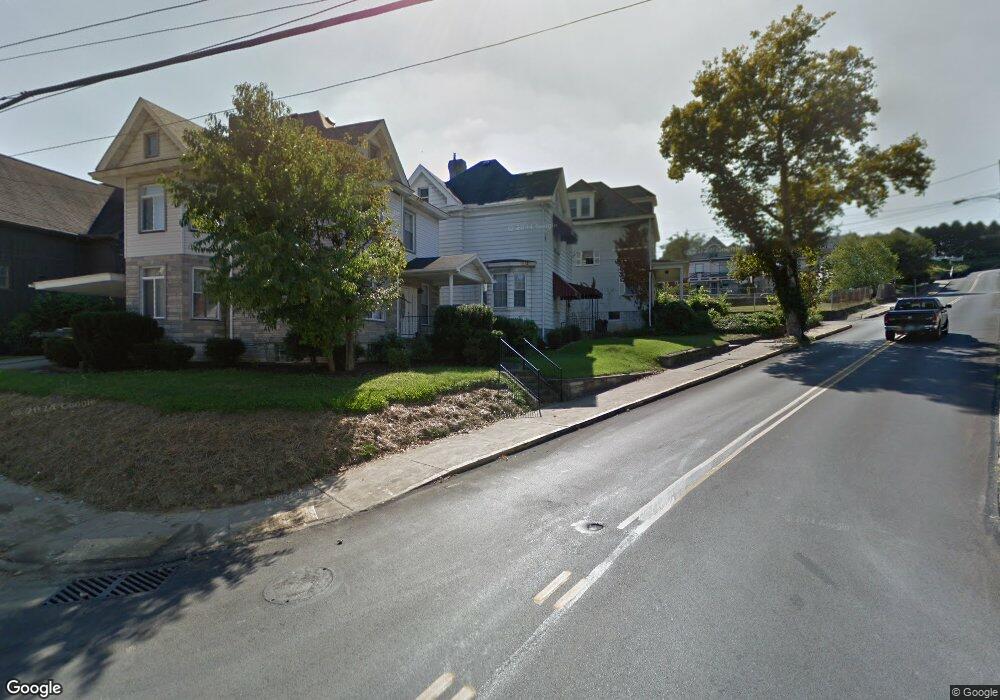
This home is located at 703 5th St, Charleroi, PA 15022 and is currently estimated at $86,831, approximately $45 per square foot. 703 5th St is a home located in Washington County with nearby schools including Charleroi Elementary Center, Charleroi Area Middle School, and Charleroi Area High School.
Ownership History
Date
Name
Owned For
Owner Type
Purchase Details
Closed on
Mar 29, 2011
Sold by
Santo Kelly C
Bought by
Susick Richard J
Current Estimated Value
Home Financials for this Owner
Home Financials are based on the most recent Mortgage that was taken out on this home.
Original Mortgage
$51,656
Outstanding Balance
$36,781
Interest Rate
5.5%
Mortgage Type
FHA
Estimated Equity
$50,050
Purchase Details
Closed on
Dec 17, 2001
Sold by
Easton Eric G
Bought by
Santo Kelly C
Home Financials for this Owner
Home Financials are based on the most recent Mortgage that was taken out on this home.
Original Mortgage
$35,677
Interest Rate
6.54%
Create a Home Valuation Report for This Property
The Home Valuation Report is an in-depth analysis detailing your home's value as well as a comparison with similar homes in the area
Home Values in the Area
Average Home Value in this Area
Purchase History
| Date | Buyer | Sale Price | Title Company |
|---|---|---|---|
| Susick Richard J | $53,000 | -- | |
| Santo Kelly C | $37,000 | -- |
Source: Public Records
Mortgage History
| Date | Status | Borrower | Loan Amount |
|---|---|---|---|
| Open | Susick Richard J | $51,656 | |
| Previous Owner | Santo Kelly C | $35,677 |
Source: Public Records
Tax History Compared to Growth
Tax History
| Year | Tax Paid | Tax Assessment Tax Assessment Total Assessment is a certain percentage of the fair market value that is determined by local assessors to be the total taxable value of land and additions on the property. | Land | Improvement |
|---|---|---|---|---|
| 2025 | $1,797 | $57,000 | $12,700 | $44,300 |
| 2024 | $1,580 | $57,000 | $12,700 | $44,300 |
| 2023 | $1,580 | $57,000 | $12,700 | $44,300 |
| 2022 | $1,531 | $57,000 | $12,700 | $44,300 |
| 2021 | $1,531 | $57,000 | $12,700 | $44,300 |
| 2020 | $1,494 | $57,000 | $12,700 | $44,300 |
| 2019 | $1,428 | $57,000 | $12,700 | $44,300 |
| 2018 | $1,345 | $57,000 | $12,700 | $44,300 |
| 2017 | $149 | $57,000 | $12,700 | $44,300 |
| 2016 | $149 | $5,983 | $901 | $5,082 |
| 2015 | -- | $5,983 | $901 | $5,082 |
| 2014 | $149 | $5,988 | $906 | $5,082 |
| 2013 | $149 | $5,988 | $906 | $5,082 |
Source: Public Records
Map
Nearby Homes