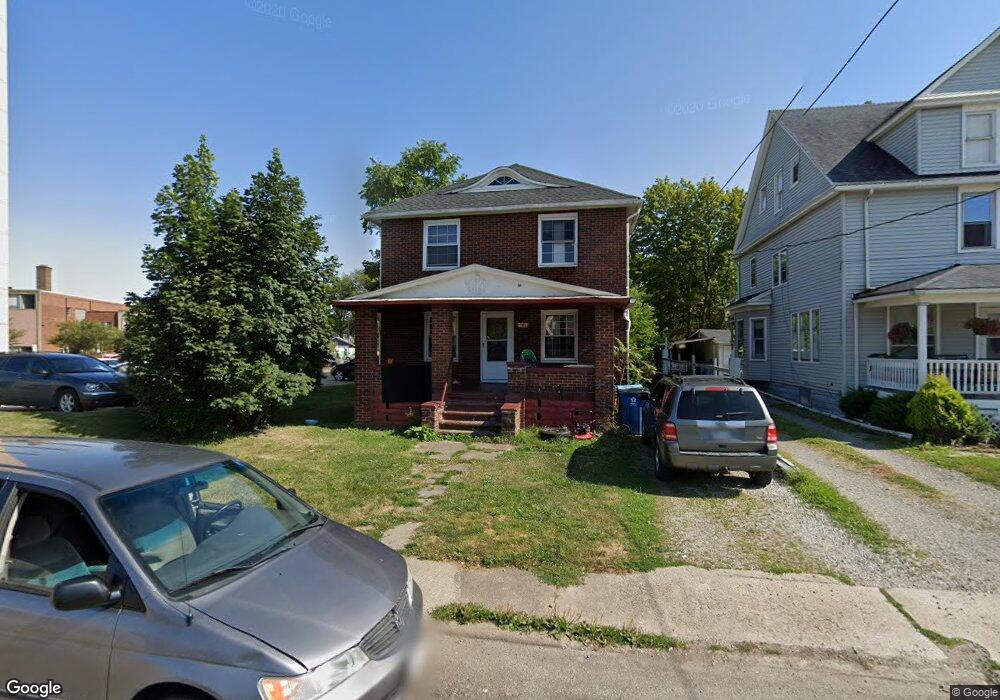
703 6th Ct Lorain, OH 44052
Estimated Value: $108,700 - $173,000
4
Beds
2
Baths
1,736
Sq Ft
$78/Sq Ft
Est. Value
About This Home
This home is located at 703 6th Ct, Lorain, OH 44052 and is currently estimated at $135,175, approximately $77 per square foot. 703 6th Ct is a home located in Lorain County with nearby schools including Admiral King Elementary School, Longfellow Middle School, and Lorain High School.
Ownership History
Date
Name
Owned For
Owner Type
Purchase Details
Closed on
Dec 31, 2018
Sold by
Ajeel Sabah K
Bought by
Donna Opps
Current Estimated Value
Purchase Details
Closed on
Apr 12, 2005
Sold by
Mortgage Electronic Registration Systems
Bought by
Ajeel Abed A and Ajeel Sabah K
Home Financials for this Owner
Home Financials are based on the most recent Mortgage that was taken out on this home.
Original Mortgage
$33,300
Interest Rate
8.3%
Mortgage Type
Fannie Mae Freddie Mac
Purchase Details
Closed on
Dec 27, 2004
Sold by
Conley Bryan R and Conley Cynthia J
Bought by
Mortgage Electronic Registration Systems and Household Finance Corp
Purchase Details
Closed on
Aug 29, 1997
Sold by
Hook Ronald P
Bought by
Conley Bryan R and Conley Cynthia J
Home Financials for this Owner
Home Financials are based on the most recent Mortgage that was taken out on this home.
Original Mortgage
$52,147
Interest Rate
7.57%
Mortgage Type
FHA
Create a Home Valuation Report for This Property
The Home Valuation Report is an in-depth analysis detailing your home's value as well as a comparison with similar homes in the area
Home Values in the Area
Average Home Value in this Area
Purchase History
| Date | Buyer | Sale Price | Title Company |
|---|---|---|---|
| Donna Opps | -- | None Available | |
| Ajeel Abed A | $37,000 | -- | |
| Mortgage Electronic Registration Systems | $35,000 | -- | |
| Conley Bryan R | $51,000 | -- |
Source: Public Records
Mortgage History
| Date | Status | Borrower | Loan Amount |
|---|---|---|---|
| Previous Owner | Ajeel Abed A | $33,300 | |
| Previous Owner | Conley Bryan R | $52,147 |
Source: Public Records
Tax History
| Year | Tax Paid | Tax Assessment Tax Assessment Total Assessment is a certain percentage of the fair market value that is determined by local assessors to be the total taxable value of land and additions on the property. | Land | Improvement |
|---|---|---|---|---|
| 2024 | $1,421 | $33,614 | $3,588 | $30,027 |
| 2023 | $1,538 | $29,110 | $3,245 | $25,865 |
| 2022 | $1,525 | $29,110 | $3,245 | $25,865 |
| 2021 | $1,525 | $29,110 | $3,245 | $25,865 |
| 2020 | $1,552 | $25,740 | $2,870 | $22,870 |
| 2019 | $1,544 | $25,740 | $2,870 | $22,870 |
| 2018 | $1,595 | $25,740 | $2,870 | $22,870 |
| 2017 | $1,646 | $25,870 | $3,230 | $22,640 |
| 2016 | $1,633 | $25,870 | $3,230 | $22,640 |
| 2015 | $1,542 | $25,870 | $3,230 | $22,640 |
| 2014 | $1,425 | $23,950 | $2,990 | $20,960 |
| 2013 | $1,415 | $23,950 | $2,990 | $20,960 |
Source: Public Records
Map
Nearby Homes
- 450 Washington Ave
- 802 W 9th St
- 1123 W 6th St
- 1169 W 6th St
- 1113 W 9th St
- 517 Oberlin Ave
- 828 W 11th St
- 366 Oberlin Ave
- 1150 W 10th St
- 1115 W 11th St
- 747 Brownell Ave
- 444 W 13th St
- 1311 W Erie Ave
- V/L W 8th St
- 323 Arizona Ave
- 1202 Oberlin Ave
- 323 California Ave
- 445 Harbor Ln
- 449 Harbor Ln
- 901 W 14th St
Your Personal Tour Guide
Ask me questions while you tour the home.