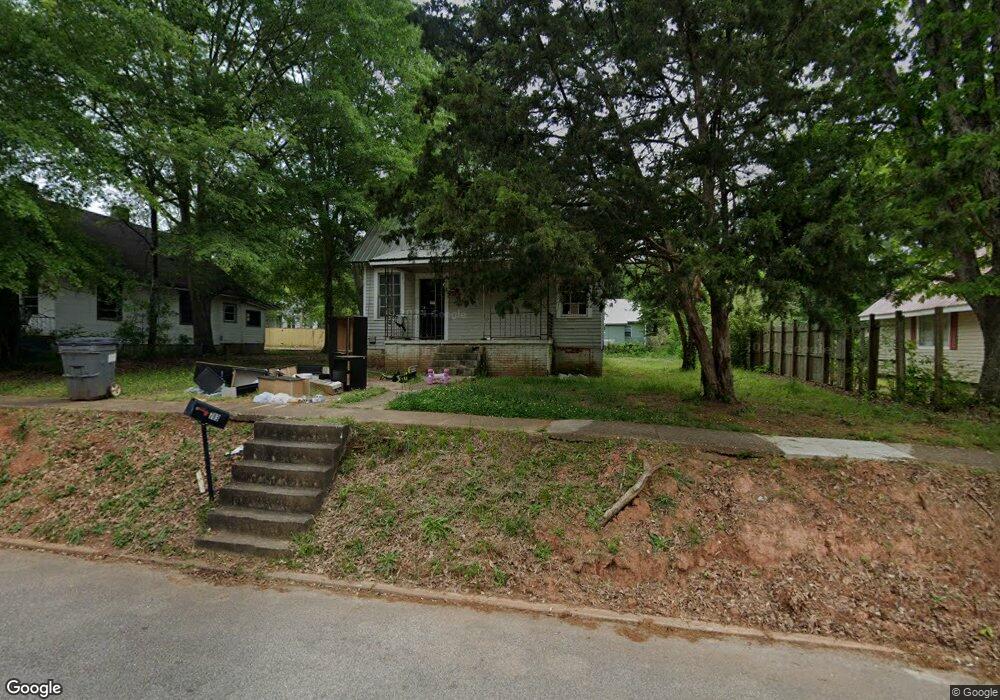
703 Askew Ave Hogansville, GA 30230
Estimated Value: $59,000 - $147,000
2
Beds
1
Bath
1,053
Sq Ft
$102/Sq Ft
Est. Value
About This Home
This home is located at 703 Askew Ave, Hogansville, GA 30230 and is currently estimated at $107,482, approximately $102 per square foot. 703 Askew Ave is a home located in Troup County with nearby schools including Hogansville Elementary School, Callaway Elementary School, and Callaway Middle School.
Ownership History
Date
Name
Owned For
Owner Type
Purchase Details
Closed on
Nov 30, 2021
Sold by
T Squared 1 Llc
Bought by
Brbrshy Investments Inc
Current Estimated Value
Purchase Details
Closed on
Jun 1, 2021
Sold by
Stribling Ty
Bought by
T Squared 1 Llc
Purchase Details
Closed on
Oct 13, 2003
Sold by
Martin J Miller
Bought by
Stribling Ty
Purchase Details
Closed on
Apr 29, 1999
Sold by
Powers G
Bought by
Martin J Miller
Purchase Details
Closed on
Mar 27, 1992
Sold by
The Citizens Bank
Bought by
Powers G
Purchase Details
Closed on
Feb 14, 1992
Sold by
Bobby L Clark
Bought by
The Citizens Bank
Purchase Details
Closed on
Dec 10, 1987
Sold by
Boswell
Bought by
Bobby L Clark
Purchase Details
Closed on
Aug 1, 1987
Sold by
Louise P Boswell
Bought by
Boswell
Purchase Details
Closed on
Oct 1, 1970
Bought by
Louise P Boswell
Purchase Details
Closed on
Jan 1, 1969
Sold by
Mrs T T Garner
Create a Home Valuation Report for This Property
The Home Valuation Report is an in-depth analysis detailing your home's value as well as a comparison with similar homes in the area
Home Values in the Area
Average Home Value in this Area
Purchase History
| Date | Buyer | Sale Price | Title Company |
|---|---|---|---|
| Brbrshy Investments Inc | $12,484,500 | -- | |
| T Squared 1 Llc | -- | -- | |
| Stribling Ty | $1,181,000 | -- | |
| Martin J Miller | $60,000 | -- | |
| Powers G | $10,200 | -- | |
| The Citizens Bank | -- | -- | |
| Bobby L Clark | $13,800 | -- | |
| Boswell | -- | -- | |
| Louise P Boswell | -- | -- | |
| -- | -- | -- |
Source: Public Records
Tax History Compared to Growth
Tax History
| Year | Tax Paid | Tax Assessment Tax Assessment Total Assessment is a certain percentage of the fair market value that is determined by local assessors to be the total taxable value of land and additions on the property. | Land | Improvement |
|---|---|---|---|---|
| 2024 | $936 | $26,560 | $6,000 | $20,560 |
| 2023 | $745 | $21,160 | $6,000 | $15,160 |
| 2022 | $598 | $16,680 | $3,000 | $13,680 |
| 2021 | $220 | $5,760 | $1,400 | $4,360 |
| 2020 | $220 | $5,760 | $1,400 | $4,360 |
| 2019 | $194 | $5,080 | $1,120 | $3,960 |
| 2018 | $194 | $5,080 | $1,120 | $3,960 |
| 2017 | $194 | $5,080 | $1,120 | $3,960 |
| 2016 | $183 | $4,800 | $1,056 | $3,744 |
| 2015 | $156 | $4,800 | $1,056 | $3,744 |
| 2014 | $130 | $3,404 | $1,408 | $1,997 |
| 2013 | -- | $3,620 | $1,408 | $2,213 |
Source: Public Records
Map
Nearby Homes
- 205 White St
- 203 White Ave
- 404 Lincoln St
- 400 Lawrence St
- 606 Green Ave
- 407 Green Ave
- 214 Collier St
- 0 Blue Cr Rd Unit 21222703
- 100 International St
- 117 Duck Walk Way
- 209 Duck Walk Way
- 1219 Blue Creek Rd
- 215 Johnson St
- 213 Johnson St
- 801 E Main St
- 50 Sportsman Club Rd
- 901 E Main St
- 201 Oak St
- 0 Georgia 100 Unit 10591508
- 613 Rifle Ridge