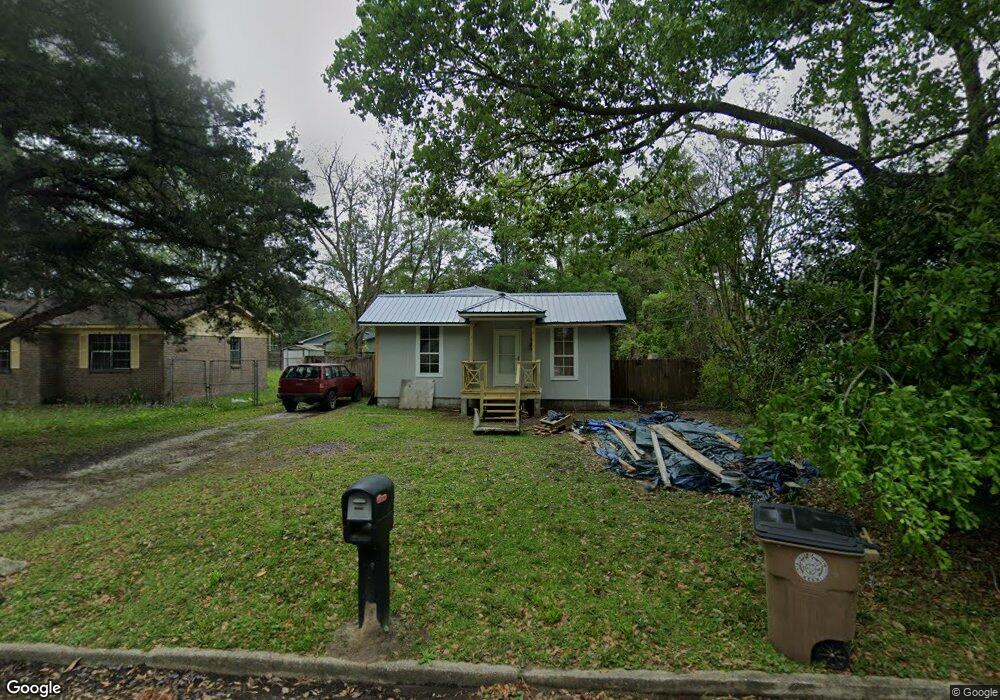
703 Bond St Mobile, AL 36607
Midtown Mobile NeighborhoodEstimated Value: $45,000 - $61,000
3
Beds
1
Bath
1,288
Sq Ft
$43/Sq Ft
Est. Value
About This Home
This home is located at 703 Bond St, Mobile, AL 36607 and is currently estimated at $55,207, approximately $42 per square foot. 703 Bond St is a home located in Mobile County with nearby schools including Holloway Elementary School, Booker T. Washington Middle School, and LeFlore High School.
Ownership History
Date
Name
Owned For
Owner Type
Purchase Details
Closed on
Nov 16, 2021
Sold by
Gulfco Of Alabama
Bought by
Milnor Katherine
Current Estimated Value
Purchase Details
Closed on
Feb 3, 2021
Sold by
Sprague Chris A
Bought by
Golfco Of Alabama
Purchase Details
Closed on
Oct 15, 2007
Sold by
Old South Investments Llc
Bought by
Sprague Chris A
Home Financials for this Owner
Home Financials are based on the most recent Mortgage that was taken out on this home.
Original Mortgage
$31,000
Interest Rate
12%
Mortgage Type
Seller Take Back
Purchase Details
Closed on
Aug 14, 2007
Sold by
Citifinancial Corp Llc
Bought by
Old South Investments Llc
Purchase Details
Closed on
May 25, 2007
Sold by
Raymond Alma L
Bought by
Citifinancial Corp Llc
Create a Home Valuation Report for This Property
The Home Valuation Report is an in-depth analysis detailing your home's value as well as a comparison with similar homes in the area
Home Values in the Area
Average Home Value in this Area
Purchase History
| Date | Buyer | Sale Price | Title Company |
|---|---|---|---|
| Milnor Katherine | $20,000 | None Available | |
| Golfco Of Alabama | $19,715 | None Available | |
| Sprague Chris A | $31,500 | None Available | |
| Old South Investments Llc | $17,000 | None Available | |
| Citifinancial Corp Llc | $23,900 | None Available |
Source: Public Records
Mortgage History
| Date | Status | Borrower | Loan Amount |
|---|---|---|---|
| Previous Owner | Sprague Chris A | $31,000 |
Source: Public Records
Tax History
| Year | Tax Paid | Tax Assessment Tax Assessment Total Assessment is a certain percentage of the fair market value that is determined by local assessors to be the total taxable value of land and additions on the property. | Land | Improvement |
|---|---|---|---|---|
| 2025 | -- | $3,830 | $600 | $3,230 |
| 2024 | -- | $3,790 | $560 | $3,230 |
| 2023 | $452 | $3,420 | $560 | $2,860 |
| 2022 | $442 | $3,480 | $560 | $2,920 |
| 2021 | $159 | $3,480 | $560 | $2,920 |
| 2020 | $159 | $3,480 | $560 | $2,920 |
| 2019 | $161 | $3,540 | $0 | $0 |
| 2018 | $161 | $3,540 | $0 | $0 |
| 2017 | $161 | $3,540 | $0 | $0 |
| 2016 | $171 | $3,720 | $0 | $0 |
| 2013 | $155 | $3,340 | $0 | $0 |
Source: Public Records
Map
Nearby Homes
- 701 Bond St
- 403 Ogden Ave
- 2957 Nall St
- 2959 Nall St
- 2464 Oakleigh Dr
- 2454 Pinetree Dr
- 411 Bay Shore Ave
- 3009 Banks Ave
- 361 Fredonia St
- 2352 Linda Dr
- 2355 Bullen St
- 114 Union Ave
- 2203 Rosa Dr
- 1320 Jessie St
- 606 Shady Oak Dr
- 1203 Next St
- 270 Del Barco Dr
- 556 Shady Oak Dr
- 2303 Roberta Dr
- 1811 Butler St
Your Personal Tour Guide
Ask me questions while you tour the home.