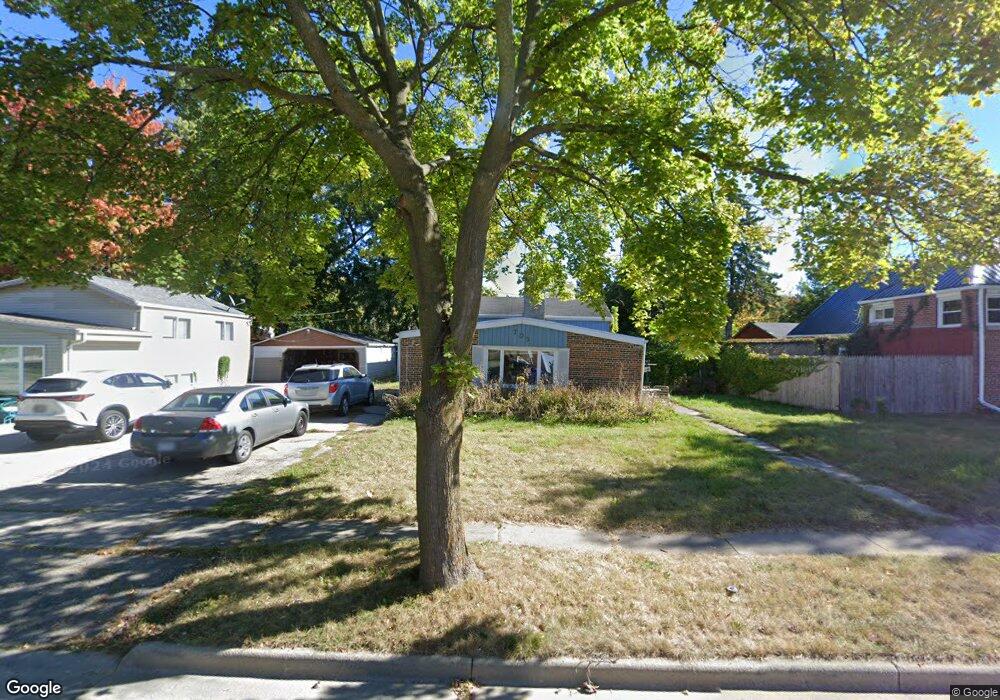
703 Carver Ln Menasha, WI 54952
Estimated Value: $169,421 - $196,000
2
Beds
1
Bath
850
Sq Ft
$216/Sq Ft
Est. Value
About This Home
This home is located at 703 Carver Ln, Menasha, WI 54952 and is currently estimated at $183,605, approximately $216 per square foot. 703 Carver Ln is a home located in Winnebago County with nearby schools including Menasha High School, Fox Valley Virtual School, and Trinity Lutheran School.
Ownership History
Date
Name
Owned For
Owner Type
Purchase Details
Closed on
Nov 7, 2017
Sold by
Sharkles Properties Llc
Bought by
Ackerman Christopher
Current Estimated Value
Home Financials for this Owner
Home Financials are based on the most recent Mortgage that was taken out on this home.
Original Mortgage
$60,000
Outstanding Balance
$50,251
Interest Rate
3.83%
Mortgage Type
Purchase Money Mortgage
Estimated Equity
$133,354
Purchase Details
Closed on
Apr 12, 2017
Sold by
Loey Lori L and Davis Karen D
Bought by
Ackerman Christopher J
Create a Home Valuation Report for This Property
The Home Valuation Report is an in-depth analysis detailing your home's value as well as a comparison with similar homes in the area
Home Values in the Area
Average Home Value in this Area
Purchase History
| Date | Buyer | Sale Price | Title Company |
|---|---|---|---|
| Ackerman Christopher | $74,933 | None Available | |
| Ackerman Christopher J | $62,300 | None Available |
Source: Public Records
Mortgage History
| Date | Status | Borrower | Loan Amount |
|---|---|---|---|
| Open | Ackerman Christopher | $60,000 |
Source: Public Records
Tax History Compared to Growth
Tax History
| Year | Tax Paid | Tax Assessment Tax Assessment Total Assessment is a certain percentage of the fair market value that is determined by local assessors to be the total taxable value of land and additions on the property. | Land | Improvement |
|---|---|---|---|---|
| 2024 | $2,376 | $130,400 | $22,500 | $107,900 |
| 2023 | $2,348 | $98,800 | $18,500 | $80,300 |
| 2022 | $2,264 | $98,800 | $18,500 | $80,300 |
| 2021 | $1,815 | $90,700 | $18,500 | $72,200 |
| 2020 | $2,150 | $84,300 | $18,500 | $65,800 |
| 2019 | $1,815 | $84,300 | $18,500 | $65,800 |
| 2018 | $1,881 | $76,500 | $11,600 | $64,900 |
| 2017 | $1,924 | $77,600 | $11,600 | $66,000 |
| 2016 | $1,886 | $77,600 | $11,600 | $66,000 |
| 2015 | $2,055 | $77,600 | $11,600 | $66,000 |
| 2014 | $2,044 | $77,600 | $11,600 | $66,000 |
| 2013 | $2,066 | $77,600 | $11,600 | $66,000 |
Source: Public Records
Map
Nearby Homes