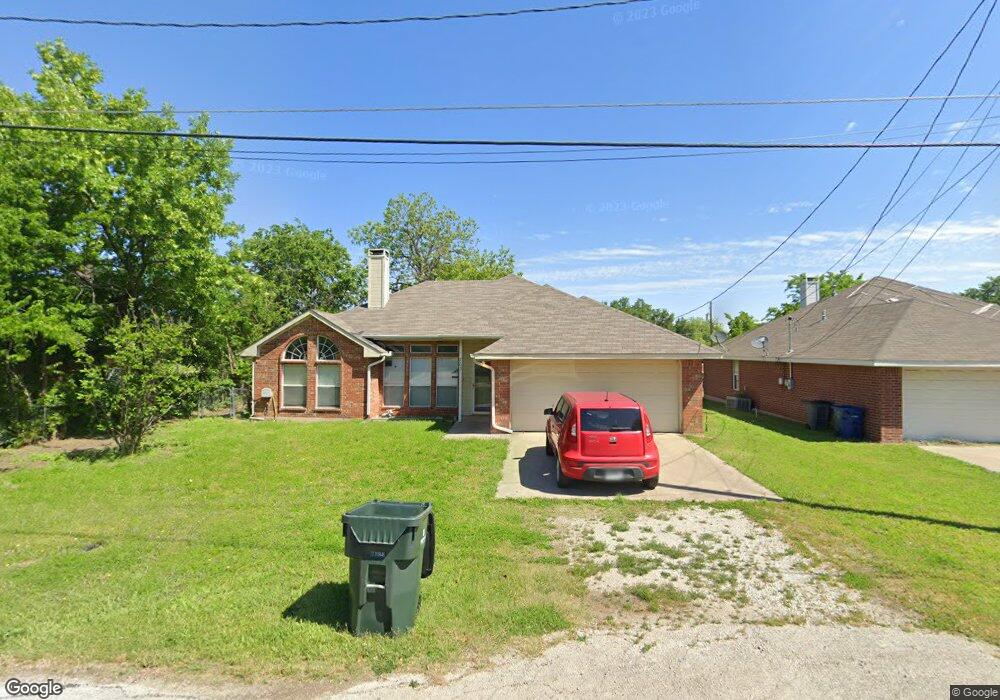
703 Church St Sanger, TX 76266
Estimated Value: $262,352 - $277,000
3
Beds
1
Bath
1,402
Sq Ft
$193/Sq Ft
Est. Value
About This Home
This home is located at 703 Church St, Sanger, TX 76266 and is currently estimated at $270,838, approximately $193 per square foot. 703 Church St is a home located in Denton County with nearby schools including Chisholm Trail Elementary School, Clear Creek Intermediate School, and Sanger Sixth Grade Campus.
Ownership History
Date
Name
Owned For
Owner Type
Purchase Details
Closed on
Jun 5, 2007
Sold by
Zafar Gina and Zafar Jamal
Bought by
Armstrong Marlee S
Current Estimated Value
Home Financials for this Owner
Home Financials are based on the most recent Mortgage that was taken out on this home.
Original Mortgage
$40,000
Outstanding Balance
$24,198
Interest Rate
6.16%
Mortgage Type
Purchase Money Mortgage
Estimated Equity
$246,640
Purchase Details
Closed on
Sep 7, 2006
Sold by
Dobbin Dysart D and Dobbin Nancy
Bought by
Zafar Jamal and Zafar Gina
Home Financials for this Owner
Home Financials are based on the most recent Mortgage that was taken out on this home.
Original Mortgage
$112,610
Interest Rate
6.64%
Mortgage Type
FHA
Purchase Details
Closed on
Jun 30, 2000
Sold by
Don Hall Construction Inc
Bought by
Dobbins Dysart D and Dobbins Nancy
Home Financials for this Owner
Home Financials are based on the most recent Mortgage that was taken out on this home.
Original Mortgage
$98,777
Interest Rate
8.66%
Mortgage Type
VA
Create a Home Valuation Report for This Property
The Home Valuation Report is an in-depth analysis detailing your home's value as well as a comparison with similar homes in the area
Home Values in the Area
Average Home Value in this Area
Purchase History
| Date | Buyer | Sale Price | Title Company |
|---|---|---|---|
| Armstrong Marlee S | -- | None Available | |
| Zafar Jamal | -- | Rtt | |
| Dobbins Dysart D | -- | -- |
Source: Public Records
Mortgage History
| Date | Status | Borrower | Loan Amount |
|---|---|---|---|
| Open | Armstrong Marlee S | $40,000 | |
| Previous Owner | Zafar Jamal | $112,610 | |
| Previous Owner | Dobbins Dysart D | $98,777 |
Source: Public Records
Tax History Compared to Growth
Tax History
| Year | Tax Paid | Tax Assessment Tax Assessment Total Assessment is a certain percentage of the fair market value that is determined by local assessors to be the total taxable value of land and additions on the property. | Land | Improvement |
|---|---|---|---|---|
| 2025 | $1,844 | $265,218 | $63,077 | $202,141 |
| 2024 | $1,844 | $262,088 | $63,077 | $207,904 |
| 2023 | $1,679 | $238,262 | $49,060 | $192,899 |
| 2022 | $2,305 | $216,602 | $38,594 | $204,908 |
| 2021 | $4,139 | $229,445 | $31,577 | $197,868 |
| 2020 | $3,961 | $179,009 | $31,577 | $149,813 |
| 2019 | $3,705 | $162,736 | $31,577 | $153,513 |
| 2018 | $3,386 | $147,942 | $31,577 | $131,270 |
| 2017 | $3,093 | $134,493 | $31,577 | $116,787 |
| 2016 | $1,861 | $122,266 | $17,543 | $108,558 |
| 2015 | $2,278 | $111,151 | $17,543 | $93,608 |
| 2013 | -- | $99,934 | $17,543 | $82,391 |
Source: Public Records
Map
Nearby Homes
- 509 Marshall St
- 710 W Willow St
- 505 Houston St
- 319 Austin St
- 109 S 5th St
- 109 Colonial Heights
- 113 Diane Dr
- 1010 Bolivar St
- 212 Diane Dr
- 411 Hughes St
- 1209 Bolivar St
- 226 Hillcrest St
- 702 Peach St Unit 2
- 185 Aster Dr
- 902 Plum St
- 612 N 10th St
- 124 Morning Glory
- 108 Magnolia Dr
- 0000 Rector Rd
- 936 First St