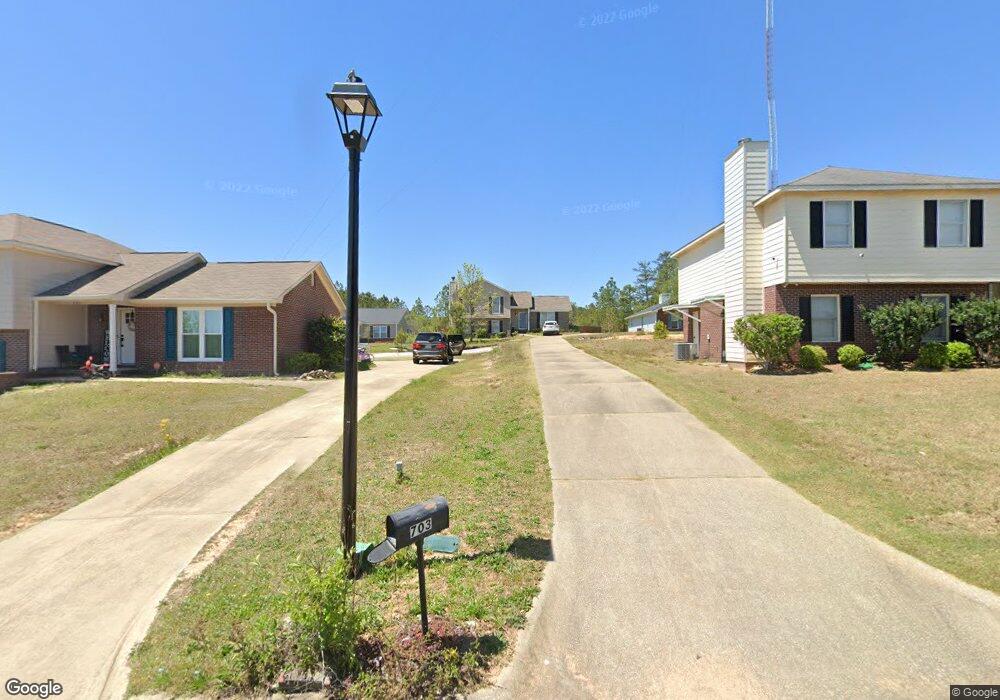
703 Crestline Dr Columbus, GA 31907
Estimated Value: $202,000 - $229,000
4
Beds
4
Baths
1,884
Sq Ft
$117/Sq Ft
Est. Value
About This Home
This home is located at 703 Crestline Dr, Columbus, GA 31907 and is currently estimated at $220,727, approximately $117 per square foot. 703 Crestline Dr is a home located in Muscogee County with nearby schools including Georgetown Elementary School, East Columbus Magnet Academy, and Kendrick High School.
Ownership History
Date
Name
Owned For
Owner Type
Purchase Details
Closed on
Nov 14, 2014
Sold by
Federal National Mortgage Association
Bought by
Walker John and Cable Amanda
Current Estimated Value
Home Financials for this Owner
Home Financials are based on the most recent Mortgage that was taken out on this home.
Original Mortgage
$93,217
Outstanding Balance
$71,063
Interest Rate
3.87%
Mortgage Type
FHA
Estimated Equity
$149,664
Purchase Details
Closed on
Aug 5, 2014
Sold by
Wells Fargo Bank
Bought by
Federal National Mtg Associati
Purchase Details
Closed on
Jan 30, 2008
Sold by
Oneal Tony R
Bought by
Oneal Tony R and Oneal Paula
Purchase Details
Closed on
Dec 29, 2006
Sold by
Wilson Michelle S
Bought by
Oneal Tony R
Home Financials for this Owner
Home Financials are based on the most recent Mortgage that was taken out on this home.
Original Mortgage
$165,000
Interest Rate
6.06%
Mortgage Type
Purchase Money Mortgage
Create a Home Valuation Report for This Property
The Home Valuation Report is an in-depth analysis detailing your home's value as well as a comparison with similar homes in the area
Home Values in the Area
Average Home Value in this Area
Purchase History
| Date | Buyer | Sale Price | Title Company |
|---|---|---|---|
| Walker John | $94,937 | -- | |
| Federal National Mtg Associati | $200,697 | -- | |
| Wells Fargo Bank | -- | -- | |
| Oneal Tony R | -- | None Available | |
| Oneal Tony R | $165,000 | None Available |
Source: Public Records
Mortgage History
| Date | Status | Borrower | Loan Amount |
|---|---|---|---|
| Open | Walker John | $93,217 | |
| Previous Owner | Oneal Tony R | $165,000 |
Source: Public Records
Tax History Compared to Growth
Tax History
| Year | Tax Paid | Tax Assessment Tax Assessment Total Assessment is a certain percentage of the fair market value that is determined by local assessors to be the total taxable value of land and additions on the property. | Land | Improvement |
|---|---|---|---|---|
| 2025 | $970 | $80,524 | $10,096 | $70,428 |
| 2024 | $969 | $80,524 | $10,096 | $70,428 |
| 2023 | $281 | $80,524 | $10,096 | $70,428 |
| 2022 | $1,011 | $60,460 | $10,096 | $50,364 |
| 2021 | $1,004 | $53,528 | $10,096 | $43,432 |
| 2020 | $1,004 | $53,528 | $10,096 | $43,432 |
| 2019 | $1,009 | $53,528 | $10,096 | $43,432 |
| 2018 | $1,009 | $53,528 | $10,096 | $43,432 |
| 2017 | $1,014 | $53,528 | $10,096 | $43,432 |
| 2016 | $1,019 | $47,840 | $6,786 | $41,054 |
| 2015 | $1,021 | $37,974 | $6,786 | $31,188 |
| 2014 | $2,729 | $66,000 | $6,786 | $59,214 |
| 2013 | -- | $66,000 | $6,786 | $59,214 |
Source: Public Records
Map
Nearby Homes
- 6416 Sandy Bottom Dr
- 5833 Bunche St
- 6008 Walters Loop
- 650 Upland Ct
- 6223 Georgetown Dr
- 908 Arlington Dr
- 803 Parkhill Dr
- 1252 School House Dr
- 5828 Georgetown Dr
- 924 Vista Dr
- 558 Wilder Dr
- 752 Wilder Dr
- 6188 Valencia Dr
- 719 Wilder Dr
- 727 Wilder Dr
- 5532 Buena Vista Rd
- 5526 Buena Vista Rd
- 736 Belvedere Dr
- 6119 Mill Branch Rd
- 935 Watson Dr
- 709 Crestline Dr
- 707 Crestline Dr
- 697 Crestline Dr
- 695 Crestline Dr
- 711 Crestline Dr
- 715 Crestline Dr
- 689 Crestline Dr
- 719 Crestline Dr
- 5800 Sandy Oak Dr
- 710 Crestline Dr
- 704 Crestline Dr
- 6379 Sandy Bottom Dr
- 6383 Sandy Bottom Dr
- 723 Crestline Dr
- 5700 Sandy View Dr
- 5804 Sandy Oak Dr
- 6387 Sandy Bottom Dr
- 5801 Sandy Oak Dr
- 5707 Sandy View Dr
- 727 Crestline Dr