3
Beds
2
Baths
1,000
Sq Ft
6,970
Sq Ft Lot
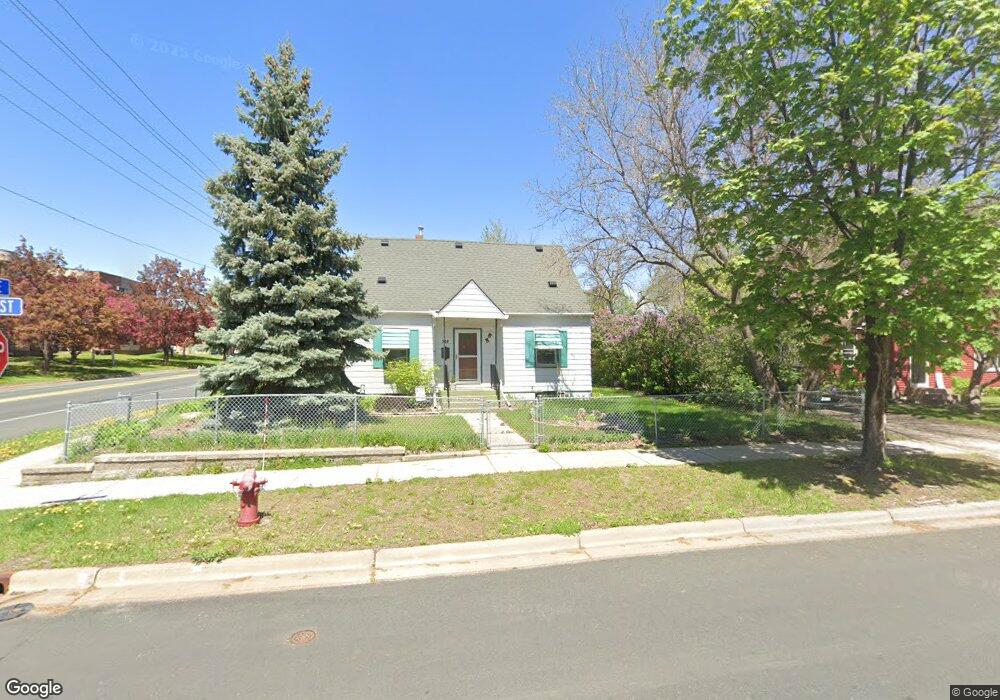
About This Home
This home is located at 703 Cross St, Anoka, MN 55303. 703 Cross St is a home located in Anoka County with nearby schools including Lincoln Elementary School for the Arts, Anoka Middle School for the Arts - Fred Moor Campus, and Anoka Senior High School.
Ownership History
Date
Name
Owned For
Owner Type
Purchase Details
Closed on
Jul 27, 2008
Sold by
The Bank Of New York Trust Co Na
Bought by
Holtmeier Lisa
Home Financials for this Owner
Home Financials are based on the most recent Mortgage that was taken out on this home.
Original Mortgage
$104,077
Interest Rate
6.51%
Mortgage Type
FHA
Purchase Details
Closed on
Jun 7, 2001
Sold by
Beckenbach Leo A
Bought by
Dennie Brandon L and Dennie Leah K
Create a Home Valuation Report for This Property
The Home Valuation Report is an in-depth analysis detailing your home's value as well as a comparison with similar homes in the area
Home Values in the Area
Average Home Value in this Area
Purchase History
| Date | Buyer | Sale Price | Title Company |
|---|---|---|---|
| Holtmeier Lisa | $104,900 | -- | |
| Dennie Brandon L | $146,900 | -- |
Source: Public Records
Mortgage History
| Date | Status | Borrower | Loan Amount |
|---|---|---|---|
| Previous Owner | Holtmeier Lisa | $104,077 |
Source: Public Records
Tax History
| Year | Tax Paid | Tax Assessment Tax Assessment Total Assessment is a certain percentage of the fair market value that is determined by local assessors to be the total taxable value of land and additions on the property. | Land | Improvement |
|---|---|---|---|---|
| 2025 | $2,338 | $230,700 | $67,000 | $163,700 |
| 2024 | $2,338 | $233,200 | $67,000 | $166,200 |
| 2023 | $2,391 | $242,200 | $67,000 | $175,200 |
| 2022 | $2,257 | $241,100 | $55,200 | $185,900 |
| 2021 | $2,153 | $203,100 | $52,000 | $151,100 |
| 2020 | $2,179 | $189,600 | $48,000 | $141,600 |
| 2019 | $2,059 | $184,800 | $47,000 | $137,800 |
| 2018 | $1,874 | $170,800 | $0 | $0 |
| 2017 | $1,746 | $151,400 | $0 | $0 |
| 2016 | $1,715 | $134,600 | $0 | $0 |
| 2015 | -- | $134,600 | $43,500 | $91,100 |
| 2014 | -- | $99,900 | $22,000 | $77,900 |
Source: Public Records
Map
Nearby Homes
- 718 Jackson St
- 614 Jackson St
- 851 Madison St
- 932 Monroe St
- 216 Monroe St
- 1625 3rd Ave
- 1224 8th Ln
- 1758 1st Ave Unit 202
- 12125 Aztec St NW
- 6xx Pierce St
- 3882 121st Cir NW
- 1005 North St
- 826 Elm St
- 1147 5th Ave
- 2820 6th Ave
- 2135 Wingfield Ave
- 2801 11th Ave
- 11673 Eldorado St NW
- 436 Park St
- 809 Bradford Ave
Your Personal Tour Guide
Ask me questions while you tour the home.