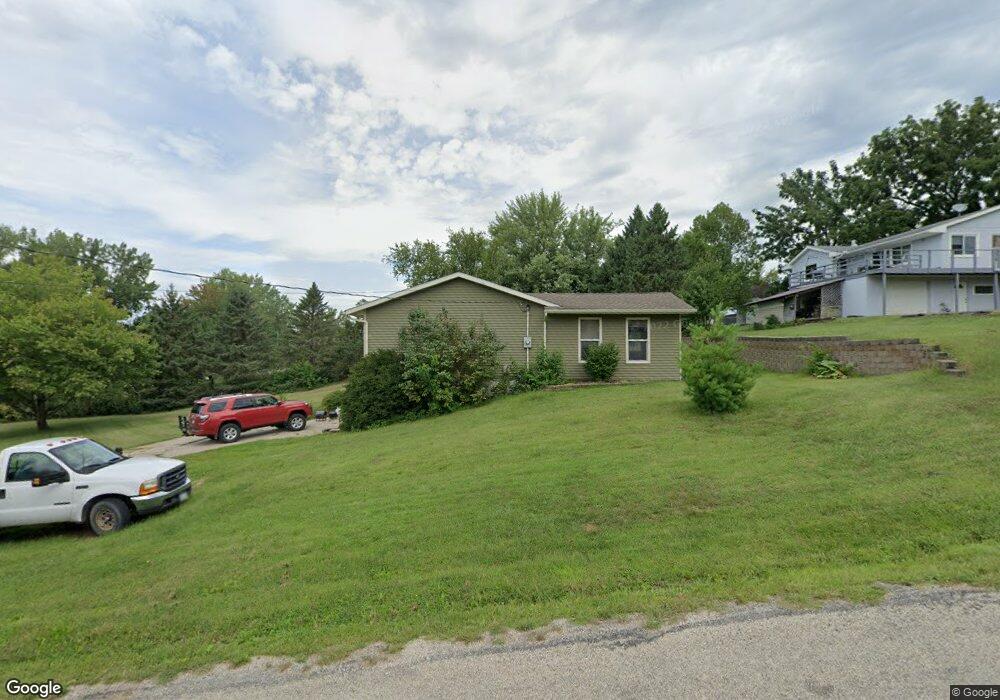
703 E 1st St Vinton, IA 52349
Estimated Value: $187,653 - $215,000
3
Beds
2
Baths
1,712
Sq Ft
$119/Sq Ft
Est. Value
About This Home
This home is located at 703 E 1st St, Vinton, IA 52349 and is currently estimated at $203,663, approximately $118 per square foot. 703 E 1st St is a home located in Benton County with nearby schools including Tilford Elementary School, Vinton-Shellsburg Middle School, and Vinton-Shellsburg High School.
Ownership History
Date
Name
Owned For
Owner Type
Purchase Details
Closed on
May 26, 2016
Sold by
Daniel R Arras
Bought by
Rockwell Joshua
Current Estimated Value
Home Financials for this Owner
Home Financials are based on the most recent Mortgage that was taken out on this home.
Original Mortgage
$115,915
Outstanding Balance
$92,216
Interest Rate
3.64%
Estimated Equity
$111,447
Create a Home Valuation Report for This Property
The Home Valuation Report is an in-depth analysis detailing your home's value as well as a comparison with similar homes in the area
Home Values in the Area
Average Home Value in this Area
Purchase History
| Date | Buyer | Sale Price | Title Company |
|---|---|---|---|
| Rockwell Joshua | -- | -- |
Source: Public Records
Mortgage History
| Date | Status | Borrower | Loan Amount |
|---|---|---|---|
| Open | Rockwell Joshua | $115,915 | |
| Closed | Rockwell Joshua | -- |
Source: Public Records
Tax History
| Year | Tax Paid | Tax Assessment Tax Assessment Total Assessment is a certain percentage of the fair market value that is determined by local assessors to be the total taxable value of land and additions on the property. | Land | Improvement |
|---|---|---|---|---|
| 2025 | $3,022 | $187,800 | $32,700 | $155,100 |
| 2024 | $3,022 | $171,500 | $32,100 | $139,400 |
| 2023 | $2,792 | $171,500 | $32,100 | $139,400 |
| 2022 | $2,864 | $138,600 | $25,700 | $112,900 |
| 2021 | $2,864 | $138,600 | $25,700 | $112,900 |
| 2020 | $2,542 | $126,300 | $25,900 | $100,400 |
| 2019 | $2,562 | $126,300 | $25,900 | $100,400 |
| 2018 | $2,484 | $125,400 | $24,900 | $100,500 |
| 2017 | $2,384 | $125,400 | $24,900 | $100,500 |
| 2016 | $2,342 | $117,200 | $23,300 | $93,900 |
| 2015 | $2,342 | $117,200 | $23,300 | $93,900 |
| 2014 | $2,372 | $118,400 | $0 | $0 |
Source: Public Records
Map
Nearby Homes
- 205 N 9th Ave
- 203 N 9th Ave
- 516 E 4th St
- 510 7th Ave
- 903 Cedar View Dr
- 304 Viking Dr
- 107 Blue Jay Ave
- 0 Lot 32 Mary Ingalls Subdivision Unit 2602214
- 606 11th Ave
- 206 Riverview Dr
- 1402 E 3rd St
- 511 1st Ave
- 209 W 5th St
- 302 E 9th St
- 212 E 9th St
- 1002 S 8th Ave
- 601 E 11th St
- 503 D Ave
- 501 E 11th St
- 206 E 13th St
Your Personal Tour Guide
Ask me questions while you tour the home.