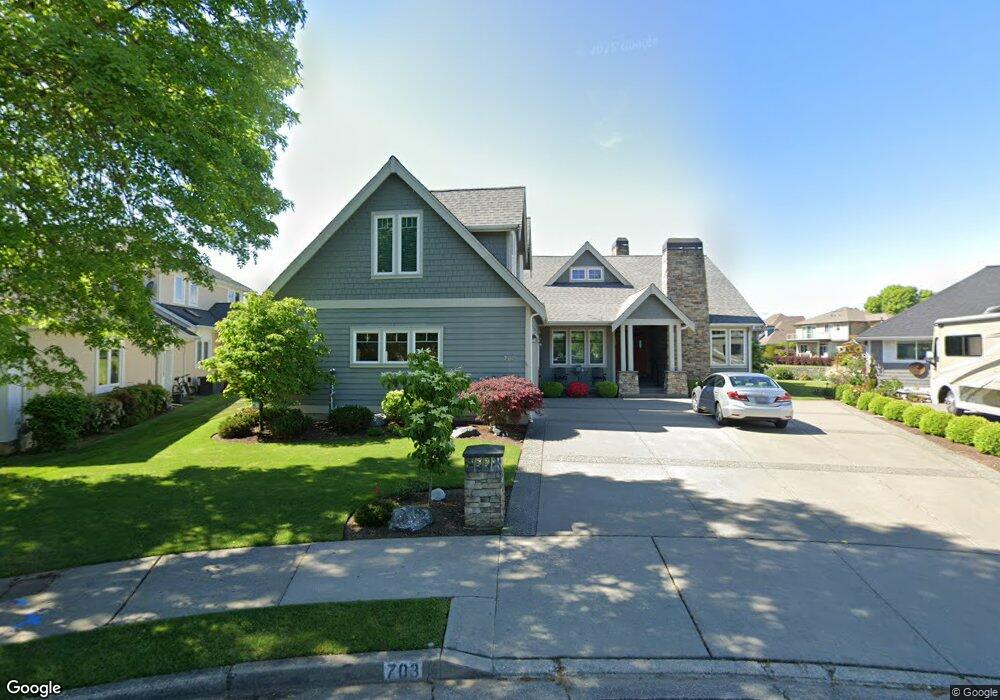
703 E Maberry Dr Lynden, WA 98264
Estimated Value: $645,000 - $791,226
2
Beds
2
Baths
2,278
Sq Ft
$319/Sq Ft
Est. Value
About This Home
This home is located at 703 E Maberry Dr, Lynden, WA 98264 and is currently estimated at $725,807, approximately $318 per square foot. 703 E Maberry Dr is a home located in Whatcom County with nearby schools including Lynden High School, Lynden Christian Schools: Administration, and Lynden Christian School.
Ownership History
Date
Name
Owned For
Owner Type
Purchase Details
Closed on
Sep 1, 2004
Sold by
Blankers Peter H and Blankers Glenda
Bought by
Blankers Peter H
Current Estimated Value
Home Financials for this Owner
Home Financials are based on the most recent Mortgage that was taken out on this home.
Original Mortgage
$120,874
Outstanding Balance
$58,342
Interest Rate
5.92%
Mortgage Type
Purchase Money Mortgage
Estimated Equity
$667,465
Purchase Details
Closed on
Aug 30, 2004
Sold by
Dejong William and Dejong Nelva
Bought by
Blankers Peter H
Home Financials for this Owner
Home Financials are based on the most recent Mortgage that was taken out on this home.
Original Mortgage
$120,874
Outstanding Balance
$58,342
Interest Rate
5.92%
Mortgage Type
Purchase Money Mortgage
Estimated Equity
$667,465
Create a Home Valuation Report for This Property
The Home Valuation Report is an in-depth analysis detailing your home's value as well as a comparison with similar homes in the area
Home Values in the Area
Average Home Value in this Area
Purchase History
| Date | Buyer | Sale Price | Title Company |
|---|---|---|---|
| Blankers Peter H | -- | -- | |
| Blankers Peter H | $140,000 | Chicago Title Insurance |
Source: Public Records
Mortgage History
| Date | Status | Borrower | Loan Amount |
|---|---|---|---|
| Open | Blankers Peter H | $120,874 |
Source: Public Records
Tax History
| Year | Tax Paid | Tax Assessment Tax Assessment Total Assessment is a certain percentage of the fair market value that is determined by local assessors to be the total taxable value of land and additions on the property. | Land | Improvement |
|---|---|---|---|---|
| 2025 | $6,347 | $854,378 | $300,108 | $554,270 |
| 2024 | $5,919 | $838,162 | $266,750 | $571,412 |
| 2023 | $5,919 | $824,435 | $275,000 | $549,435 |
| 2022 | $6,317 | $829,736 | $225,638 | $604,098 |
| 2021 | $6,196 | $685,724 | $186,475 | $499,249 |
| 2020 | $5,427 | $612,270 | $166,500 | $445,770 |
| 2019 | $4,828 | $561,497 | $152,875 | $408,622 |
| 2018 | $5,277 | $512,110 | $139,263 | $372,847 |
| 2017 | $4,976 | $459,662 | $125,000 | $334,662 |
| 2016 | $4,691 | $461,026 | $126,500 | $334,526 |
| 2015 | $4,158 | $432,334 | $121,670 | $310,664 |
| 2014 | -- | $417,688 | $117,530 | $300,158 |
| 2013 | -- | $415,158 | $115,000 | $300,158 |
Source: Public Records
Map
Nearby Homes
- 114 Twin Sister Loop
- 0 Bender Rd
- 212 W Maberry Dr Unit 302
- 167 Cambridge Dr
- 107 Springview Dr
- 137 E Cedar Dr
- 8780 Depot Rd Unit 207
- 8780 Depot Rd Unit 309
- 790 E Badger Rd
- 1725 Harrison Place Unit 106
- 8872 Depot Rd Unit 203
- 1125 N Cascade Ct
- 1136 N Cascade Ct
- 0 Island Green Way
- 600 Sunrise Dr
- 301 S Park St
- 924 E Grover St
- 1095 Terrace Dr
- 761 Sunrise Dr
- 2274 Dogwood St
- 705 E Maberry Dr
- 701 E Maberry Dr
- 707 E Maberry Dr
- 803 E Maberry Dr
- 805 E Maberry Dr
- 801 E Maberry Dr
- 673 E Maberry Dr
- 807 E Maberry Dr
- 661 E Maberry Dr
- 702 E Maberry Dr
- 704 E Maberry Dr
- 700 E Maberry Dr
- 800 E Maberry Dr
- 649 E Maberry Dr
- 809 E Maberry Dr
- 802 E Maberry Dr
- 804 E Maberry Dr
- 637 E Maberry Dr
- 660 E Maberry Dr
- 806 E Maberry Dr
Your Personal Tour Guide
Ask me questions while you tour the home.