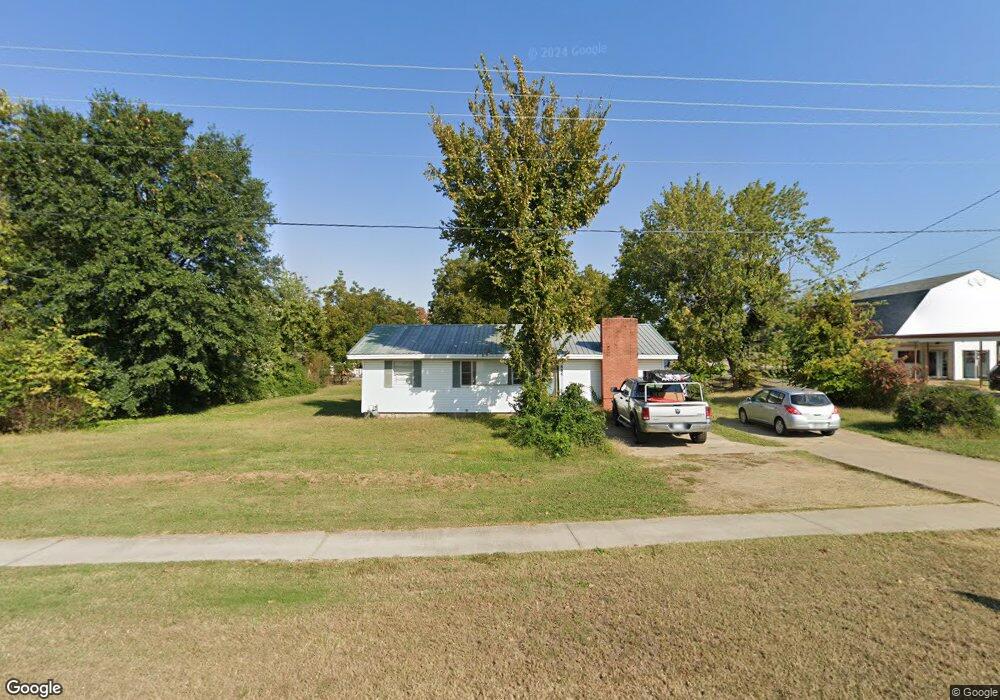
703 E Shawntel Smith Blvd Muldrow, OK 74948
Estimated Value: $94,556 - $117,000
3
Beds
1
Bath
1,144
Sq Ft
$92/Sq Ft
Est. Value
About This Home
This home is located at 703 E Shawntel Smith Blvd, Muldrow, OK 74948 and is currently estimated at $104,889, approximately $91 per square foot. 703 E Shawntel Smith Blvd is a home located in Sequoyah County with nearby schools including Muldrow Elementary School, Muldrow Middle School, and Muldrow High School.
Ownership History
Date
Name
Owned For
Owner Type
Purchase Details
Closed on
Oct 5, 2021
Sold by
Long Savin and Keng Dinyn
Bought by
Copeland Kevin and Copeland Briana
Current Estimated Value
Home Financials for this Owner
Home Financials are based on the most recent Mortgage that was taken out on this home.
Original Mortgage
$50,239
Outstanding Balance
$38,089
Interest Rate
2.1%
Mortgage Type
Future Advance Clause Open End Mortgage
Estimated Equity
$66,800
Purchase Details
Closed on
May 30, 2017
Sold by
Williams Legancy Inc
Bought by
Long Savin
Home Financials for this Owner
Home Financials are based on the most recent Mortgage that was taken out on this home.
Original Mortgage
$121,381
Interest Rate
3.97%
Mortgage Type
Unknown
Purchase Details
Closed on
Aug 11, 2014
Sold by
Long Savin
Bought by
Long Dinyn and Long Savin
Purchase Details
Closed on
Jul 28, 2010
Sold by
Tep Stephaine
Bought by
Long Angkearot
Create a Home Valuation Report for This Property
The Home Valuation Report is an in-depth analysis detailing your home's value as well as a comparison with similar homes in the area
Home Values in the Area
Average Home Value in this Area
Purchase History
| Date | Buyer | Sale Price | Title Company |
|---|---|---|---|
| Copeland Kevin | $60,000 | Sca Title Llc | |
| Long Savin | $120,000 | None Available | |
| Long Dinyn | -- | -- | |
| Long Angkearot | $60,000 | None Available |
Source: Public Records
Mortgage History
| Date | Status | Borrower | Loan Amount |
|---|---|---|---|
| Open | Copeland Kevin | $50,239 | |
| Previous Owner | Long Savin | $121,381 |
Source: Public Records
Tax History
| Year | Tax Paid | Tax Assessment Tax Assessment Total Assessment is a certain percentage of the fair market value that is determined by local assessors to be the total taxable value of land and additions on the property. | Land | Improvement |
|---|---|---|---|---|
| 2025 | $670 | $9,434 | $1,972 | $7,462 |
| 2024 | $670 | $8,984 | $1,100 | $7,884 |
| 2023 | $638 | $8,557 | $1,100 | $7,457 |
| 2022 | $579 | $8,149 | $1,100 | $7,049 |
| 2021 | $734 | $10,329 | $1,100 | $9,229 |
| 2020 | $734 | $10,329 | $1,100 | $9,229 |
| 2019 | $751 | $10,571 | $1,100 | $9,471 |
| 2018 | $737 | $10,368 | $660 | $9,708 |
| 2017 | $466 | $6,562 | $660 | $5,902 |
| 2016 | $480 | $6,760 | $660 | $6,100 |
| 2015 | $470 | $6,612 | $660 | $5,952 |
| 2014 | $469 | $6,600 | $1,100 | $5,500 |
Source: Public Records
Map
Nearby Homes
- 701 E Shawntel Smith Blvd
- - U S Highway 64
- 612 E Sequoyah St
- 6006 Shawntel Smith Blvd
- 608 NW 4th St
- 703 SE 9th St
- 705 SE 9th St
- 701 SE 9th St
- 601 Shawntel Smith
- 601 E Shawntel Smith Blvd
- 709 SE 9th St
- 104182 S 4767 Rd
- 700 SE 9th St
- 704 SE 9th St
- 708 SE 9th St
- 605 S Fir St
- 603 S Fir St
- 601 S Fir St
- 903 Short St
- 76 Saddleback
Your Personal Tour Guide
Ask me questions while you tour the home.