Estimated Value: $206,000 - $213,000
3
Beds
2
Baths
2,112
Sq Ft
$100/Sq Ft
Est. Value
About This Home
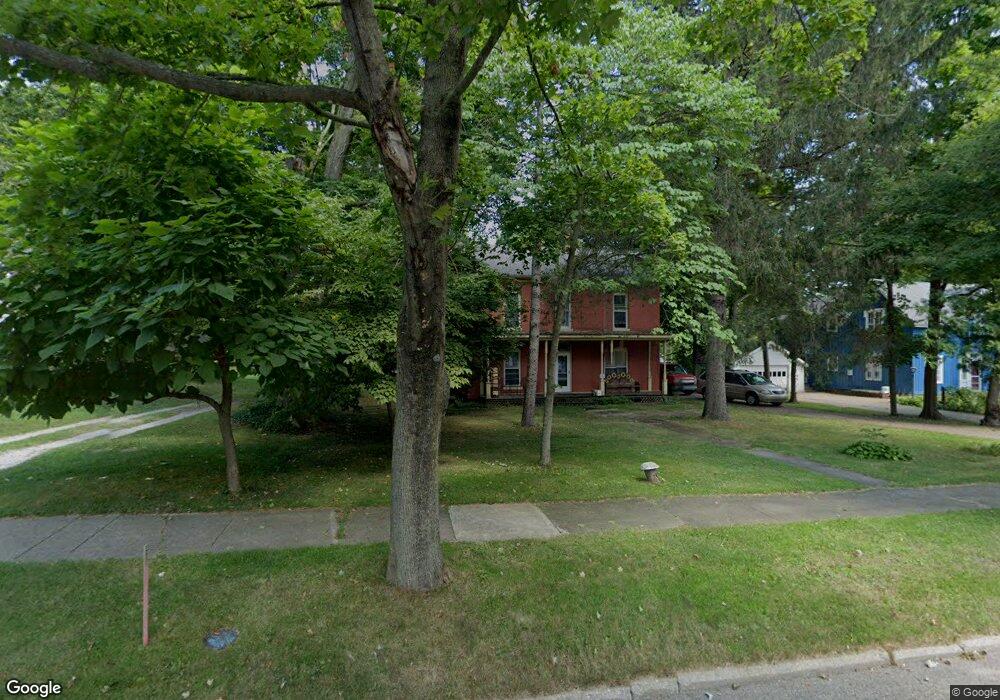
This home is located at 703 Grant St, Niles, MI 49120 and is currently estimated at $210,564, approximately $99 per square foot. 703 Grant St is a home located in Berrien County with nearby schools including Ballard Elementary School, Oak Manor Sixth Grade Center, and Ring Lardner Middle School.
Ownership History
Date
Name
Owned For
Owner Type
Purchase Details
Closed on
Jun 17, 2024
Sold by
Vo Thuoc and Vo Hai
Bought by
Berrien County Treasurer
Current Estimated Value
Purchase Details
Closed on
Jul 20, 2012
Sold by
Vo Thuoc and Vo Hai
Bought by
Acosta Lucilo H and Alvarez Lilliana Isabel Castillo
Purchase Details
Closed on
May 24, 2004
Sold by
Gorman Kirk and Gorman Denise N
Bought by
Vo Thuoc and Vo Hai
Purchase Details
Closed on
Nov 19, 2002
Purchase Details
Closed on
Mar 7, 2002
Purchase Details
Closed on
Apr 20, 1994
Create a Home Valuation Report for This Property
The Home Valuation Report is an in-depth analysis detailing your home's value as well as a comparison with similar homes in the area
Home Values in the Area
Average Home Value in this Area
Purchase History
| Date | Buyer | Sale Price | Title Company |
|---|---|---|---|
| Berrien County Treasurer | -- | -- | |
| Acosta Lucilo H | $65,000 | None Available | |
| Vo Thuoc | $25,500 | Meridian Title Corp | |
| -- | $15,500 | -- | |
| -- | $105,200 | -- | |
| -- | $21,700 | -- |
Source: Public Records
Tax History Compared to Growth
Tax History
| Year | Tax Paid | Tax Assessment Tax Assessment Total Assessment is a certain percentage of the fair market value that is determined by local assessors to be the total taxable value of land and additions on the property. | Land | Improvement |
|---|---|---|---|---|
| 2025 | $2,065 | $99,100 | $0 | $0 |
| 2024 | $1,634 | $91,900 | $0 | $0 |
| 2023 | $1,566 | $80,200 | $0 | $0 |
| 2022 | $1,492 | $75,800 | $0 | $0 |
| 2021 | $1,822 | $66,300 | $6,100 | $60,200 |
| 2020 | $1,802 | $67,100 | $0 | $0 |
| 2019 | $1,780 | $52,500 | $2,800 | $49,700 |
| 2018 | $1,721 | $52,500 | $0 | $0 |
| 2017 | $1,692 | $44,600 | $0 | $0 |
| 2016 | $1,867 | $49,900 | $0 | $0 |
| 2015 | $1,968 | $53,000 | $0 | $0 |
| 2014 | $1,547 | $52,700 | $0 | $0 |
Source: Public Records
Map
Nearby Homes