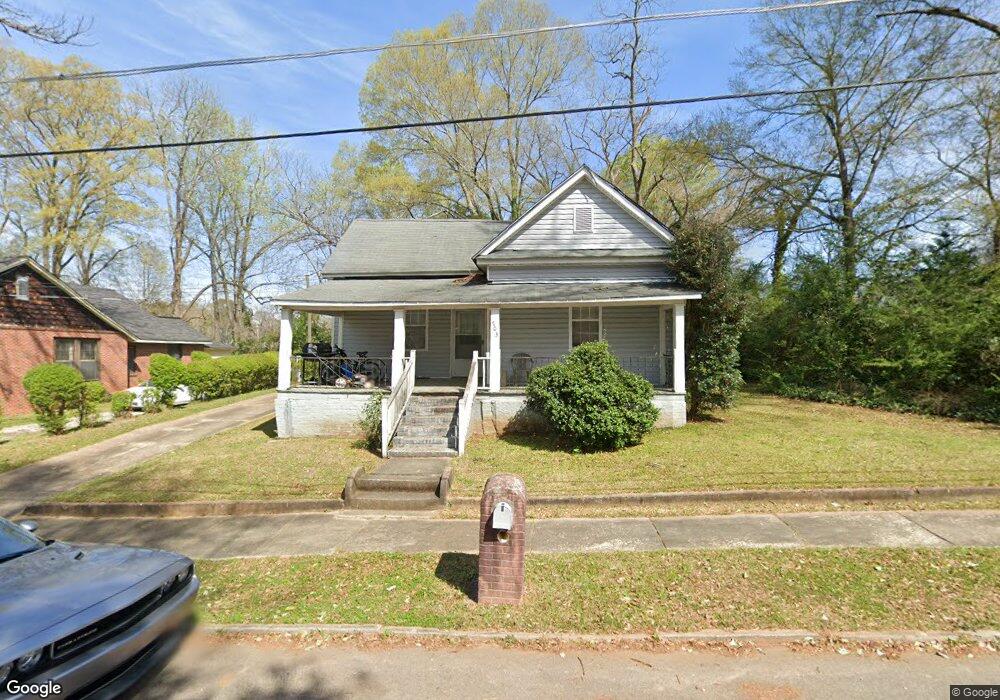
703 Juniper St Lagrange, GA 30240
Estimated Value: $76,000 - $188,000
3
Beds
2
Baths
1,254
Sq Ft
$97/Sq Ft
Est. Value
About This Home
This home is located at 703 Juniper St, Lagrange, GA 30240 and is currently estimated at $121,088, approximately $96 per square foot. 703 Juniper St is a home located in Troup County with nearby schools including Ethel W. Kight Elementary School, Hollis Hand Elementary School, and Franklin Forest Elementary School.
Ownership History
Date
Name
Owned For
Owner Type
Purchase Details
Closed on
Feb 3, 2005
Sold by
Homeq Servicing Corp
Bought by
Mckeen Lamar
Current Estimated Value
Purchase Details
Closed on
Nov 2, 2004
Sold by
Calvin Keys and Diane Keys
Bought by
Homeq Servicing
Purchase Details
Closed on
Oct 8, 1996
Sold by
Diane Cameron
Bought by
Calvin Keys and Diane Keys
Purchase Details
Closed on
Dec 14, 1979
Sold by
Longshore Ted M and Longshore Marsha W
Bought by
Diane Cameron
Purchase Details
Closed on
Feb 21, 1978
Sold by
Spinks Calvin T
Bought by
Longshore Ted M and Longshore Marsha W
Purchase Details
Closed on
Feb 10, 1978
Sold by
Olinger Ralph and Olinger Catherine
Bought by
Spinks Calvin T
Purchase Details
Closed on
Dec 5, 1975
Sold by
Martin R D
Bought by
Olinger Ralph and Olinger Catherine
Purchase Details
Closed on
Aug 27, 1975
Sold by
Churchill Ella and Churchill Gladys
Bought by
Martin R D
Create a Home Valuation Report for This Property
The Home Valuation Report is an in-depth analysis detailing your home's value as well as a comparison with similar homes in the area
Purchase History
| Date | Buyer | Sale Price | Title Company |
|---|---|---|---|
| Mckeen Lamar | $13,500 | -- | |
| Homeq Servicing | -- | -- | |
| Homeq Servicing Corp | -- | -- | |
| Calvin Keys | -- | -- | |
| Diane Cameron | $14,900 | -- | |
| Longshore Ted M | $3,500 | -- | |
| Spinks Calvin T | $13,800 | -- | |
| Olinger Ralph | $7,800 | -- | |
| Martin R D | $8,500 | -- |
Source: Public Records
Tax History
| Year | Tax Paid | Tax Assessment Tax Assessment Total Assessment is a certain percentage of the fair market value that is determined by local assessors to be the total taxable value of land and additions on the property. | Land | Improvement |
|---|---|---|---|---|
| 2025 | $692 | $25,360 | $4,480 | $20,880 |
| 2024 | $488 | $17,880 | $4,480 | $13,400 |
| 2023 | $472 | $17,320 | $4,480 | $12,840 |
| 2022 | $461 | $16,520 | $4,480 | $12,040 |
| 2021 | $370 | $12,280 | $4,480 | $7,800 |
| 2020 | $370 | $12,280 | $4,480 | $7,800 |
| 2019 | $367 | $12,160 | $3,560 | $8,600 |
| 2018 | $367 | $12,160 | $3,560 | $8,600 |
| 2017 | $390 | $12,945 | $3,825 | $9,120 |
| 2016 | $385 | $12,782 | $3,825 | $8,956 |
| 2015 | $372 | $12,328 | $3,371 | $8,956 |
| 2014 | $337 | $11,133 | $3,240 | $7,893 |
| 2013 | -- | $11,728 | $3,240 | $8,488 |
Source: Public Records
Map
Nearby Homes
Your Personal Tour Guide
Ask me questions while you tour the home.