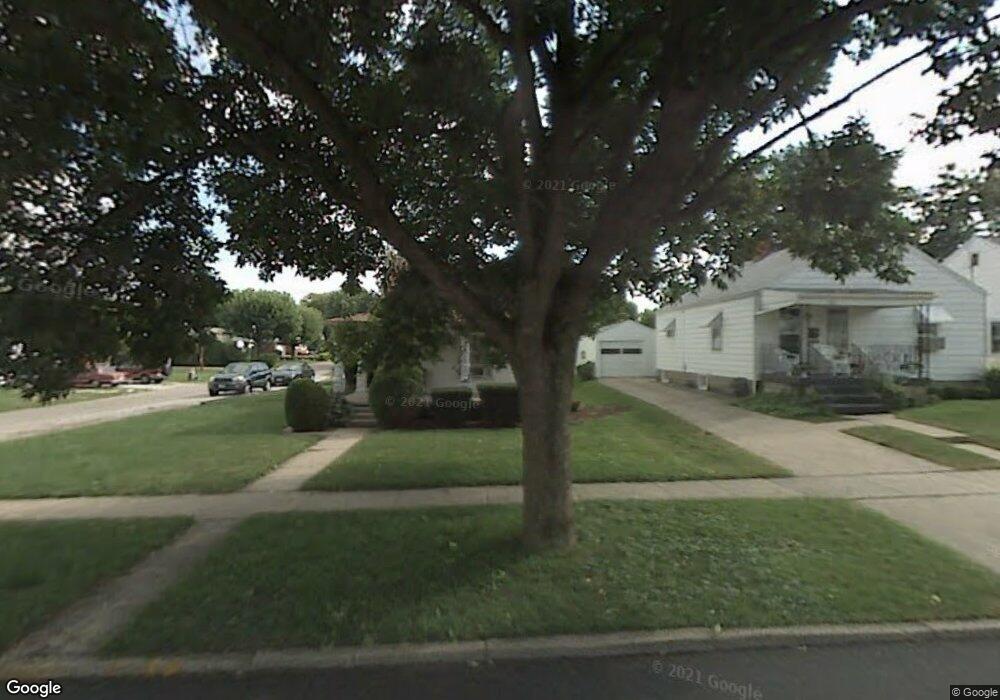
703 Lynn St Sidney, OH 45365
Estimated Value: $118,000 - $146,000
3
Beds
1
Bath
1,584
Sq Ft
$82/Sq Ft
Est. Value
About This Home
This home is located at 703 Lynn St, Sidney, OH 45365 and is currently estimated at $130,117, approximately $82 per square foot. 703 Lynn St is a home located in Shelby County with nearby schools including Sidney High School, Holy Angels Catholic School, and Christian Academy Schools.
Ownership History
Date
Name
Owned For
Owner Type
Purchase Details
Closed on
Apr 8, 2025
Sold by
Alexander Bob and Alexander Robert L
Bought by
Alexander Robert Leroy
Current Estimated Value
Purchase Details
Closed on
Oct 28, 2009
Sold by
Bank Of America National Association
Bought by
Alexander Bob
Purchase Details
Closed on
May 28, 2009
Sold by
Wagner Robert D and Wagner Jessica
Bought by
Bank Of America National Association
Purchase Details
Closed on
Jul 19, 1999
Sold by
Betcher Joseph W
Bought by
Murphy Jessica
Home Financials for this Owner
Home Financials are based on the most recent Mortgage that was taken out on this home.
Original Mortgage
$40,150
Interest Rate
7.43%
Mortgage Type
New Conventional
Create a Home Valuation Report for This Property
The Home Valuation Report is an in-depth analysis detailing your home's value as well as a comparison with similar homes in the area
Home Values in the Area
Average Home Value in this Area
Purchase History
| Date | Buyer | Sale Price | Title Company |
|---|---|---|---|
| Alexander Robert Leroy | -- | None Listed On Document | |
| Alexander Robert Leroy | -- | None Listed On Document | |
| Alexander Bob | $28,500 | Reliable Land Title Agency L | |
| Bank Of America National Association | $31,334 | None Available | |
| Murphy Jessica | $41,400 | -- |
Source: Public Records
Mortgage History
| Date | Status | Borrower | Loan Amount |
|---|---|---|---|
| Previous Owner | Murphy Jessica | $40,150 |
Source: Public Records
Tax History Compared to Growth
Tax History
| Year | Tax Paid | Tax Assessment Tax Assessment Total Assessment is a certain percentage of the fair market value that is determined by local assessors to be the total taxable value of land and additions on the property. | Land | Improvement |
|---|---|---|---|---|
| 2024 | $1,158 | $32,150 | $5,550 | $26,600 |
| 2023 | $1,158 | $32,150 | $5,550 | $26,600 |
| 2022 | $992 | $24,140 | $4,250 | $19,890 |
| 2021 | $1,002 | $24,140 | $4,250 | $19,890 |
| 2020 | $1,002 | $24,140 | $4,250 | $19,890 |
| 2019 | $893 | $21,580 | $3,590 | $17,990 |
| 2018 | $881 | $21,580 | $3,590 | $17,990 |
| 2017 | $886 | $21,580 | $3,590 | $17,990 |
| 2016 | $710 | $17,550 | $3,590 | $13,960 |
| 2015 | $713 | $17,550 | $3,590 | $13,960 |
| 2014 | $713 | $17,550 | $3,590 | $13,960 |
| 2013 | $755 | $17,190 | $3,590 | $13,600 |
Source: Public Records
Map
Nearby Homes
- 717 Taft St
- 518 Rauth St
- 418 S Wagner Ave
- 610 Fair Rd
- 649 Fair Rd
- 608 Foraker Ave
- 104 S Pomeroy Ave
- 707 Chestnut Ave
- 330 S Walnut Ave
- 508 Urban Ave
- 747 Chestnut Ave
- 619 Michigan St
- 501 S West Ave
- 131 Mound St
- 119 & 121 W Water St
- 614 Michigan St
- 544 Michigan St
- 805 Chestnut Ave
- 812 Chestnut Ave
- 420 S Ohio Ave