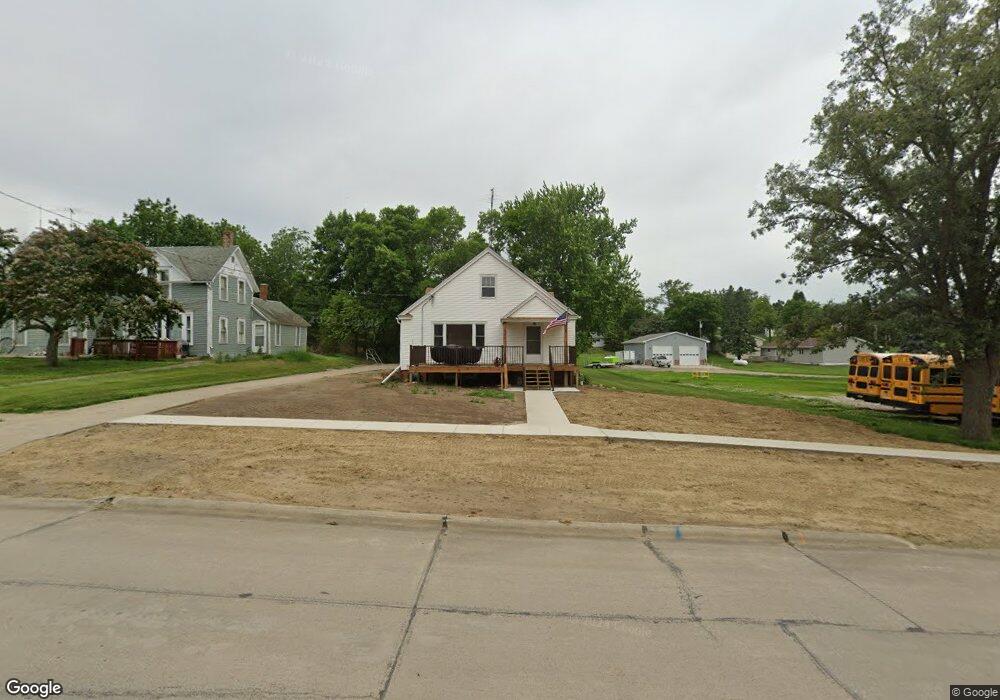
703 Main St Bancroft, NE 68004
Estimated Value: $70,000 - $131,000
2
Beds
2
Baths
1,260
Sq Ft
$82/Sq Ft
Est. Value
About This Home
This home is located at 703 Main St, Bancroft, NE 68004 and is currently estimated at $103,618, approximately $82 per square foot. 703 Main St is a home located in Cuming County with nearby schools including Bancroft-Rosalie Elementary School.
Ownership History
Date
Name
Owned For
Owner Type
Purchase Details
Closed on
Nov 9, 2015
Sold by
Knudtson Sharon and Knudtson Jeffrey
Bought by
Toft Jonathon G and Toft Sara B
Current Estimated Value
Home Financials for this Owner
Home Financials are based on the most recent Mortgage that was taken out on this home.
Original Mortgage
$45,409
Outstanding Balance
$18,088
Interest Rate
3.81%
Mortgage Type
New Conventional
Estimated Equity
$85,530
Purchase Details
Closed on
May 6, 2011
Sold by
Backmann Betyy
Bought by
Knudtson Sharon and Buhrman Diane
Create a Home Valuation Report for This Property
The Home Valuation Report is an in-depth analysis detailing your home's value as well as a comparison with similar homes in the area
Purchase History
| Date | Buyer | Sale Price | Title Company |
|---|---|---|---|
| Toft Jonathon G | $50,000 | None Available | |
| Knudtson Sharon | -- | -- |
Source: Public Records
Mortgage History
| Date | Status | Borrower | Loan Amount |
|---|---|---|---|
| Open | Toft Jonathon G | $45,409 |
Source: Public Records
Tax History
| Year | Tax Paid | Tax Assessment Tax Assessment Total Assessment is a certain percentage of the fair market value that is determined by local assessors to be the total taxable value of land and additions on the property. | Land | Improvement |
|---|---|---|---|---|
| 2025 | $831 | $119,525 | $4,335 | $115,190 |
| 2024 | $831 | $82,360 | $4,335 | $78,025 |
| 2023 | $728 | $56,025 | $3,215 | $52,810 |
| 2022 | $764 | $53,575 | $3,215 | $50,360 |
| 2021 | $878 | $61,610 | $2,270 | $59,340 |
| 2020 | $900 | $61,610 | $2,270 | $59,340 |
| 2019 | $860 | $59,145 | $2,270 | $56,875 |
| 2018 | $714 | $49,455 | $2,270 | $47,185 |
| 2017 | $680 | $49,455 | $2,270 | $47,185 |
| 2016 | $654 | $49,455 | $2,270 | $47,185 |
| 2015 | -- | $49,455 | $2,270 | $47,185 |
| 2014 | -- | $46,865 | $2,270 | $44,595 |
| 2013 | -- | $46,865 | $2,270 | $44,595 |
Source: Public Records
Map
Nearby Homes
- 209 E Grove St
- 103 Washington St
- 2615 P Ave
- Lot 94 Blue Sage
- 330 Pearl St
- 440 State St
- 325 Crystal St
- 204 2nd St
- 305 Carnes Ave
- 1107 Whitney St
- 1111 Whitney St
- 203 S Little St
- Road 14 Road W Rd
- 1225 Co Road 1
- Lyons Unit NE 68038
- 1245 M Ave
- 820 N Oakland Ave
- 521 N Logan Ave
- 515 N Thomas Ave
- 1301 N Mill St
Your Personal Tour Guide
Ask me questions while you tour the home.