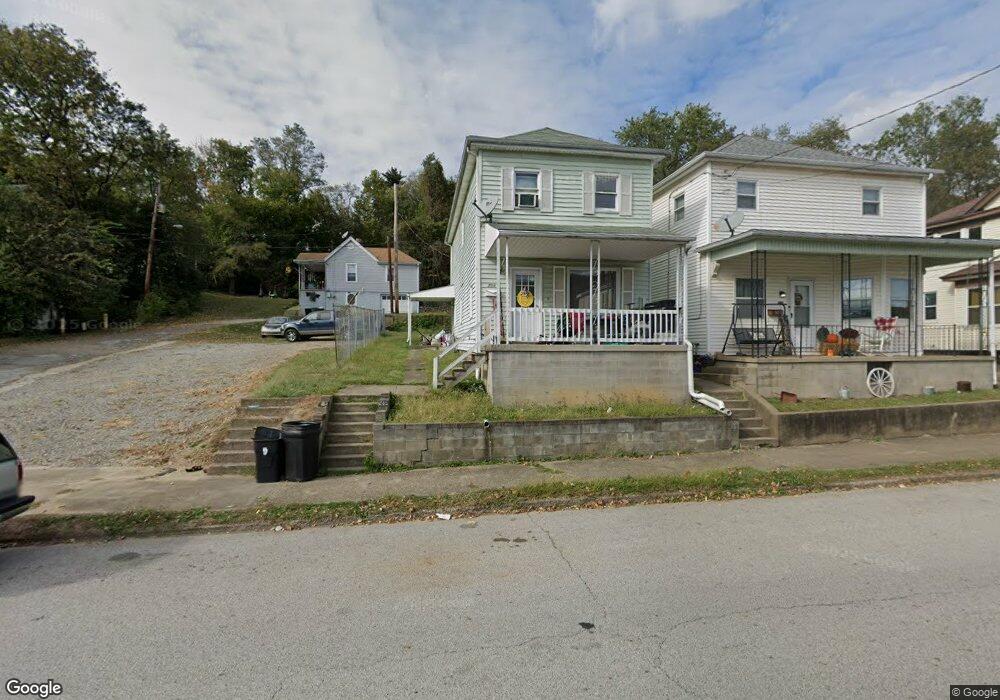
703 N 5th St Martins Ferry, OH 43935
Estimated Value: $71,000 - $219,000
3
Beds
2
Baths
1,344
Sq Ft
$102/Sq Ft
Est. Value
About This Home
This home is located at 703 N 5th St, Martins Ferry, OH 43935 and is currently estimated at $137,311, approximately $102 per square foot. 703 N 5th St is a home located in Belmont County with nearby schools including Anna Marie Ayers Elementary School, Martins Ferry Middle School, and Martins Ferry High School.
Ownership History
Date
Name
Owned For
Owner Type
Purchase Details
Closed on
Dec 29, 2020
Sold by
Gantzer Gregory R and Gantzer Mary Rrebecca
Bought by
Villa Rental Properties Llc
Current Estimated Value
Home Financials for this Owner
Home Financials are based on the most recent Mortgage that was taken out on this home.
Original Mortgage
$128,000
Outstanding Balance
$114,220
Interest Rate
2.7%
Mortgage Type
New Conventional
Estimated Equity
$23,091
Purchase Details
Closed on
Mar 8, 2011
Sold by
Beyer Sheila and Hsbc Mortgage Services Inc
Bought by
Gantzer Gregory R
Purchase Details
Closed on
Jan 5, 2006
Sold by
Rare Properties Inc
Bought by
Beyer Sheila
Home Financials for this Owner
Home Financials are based on the most recent Mortgage that was taken out on this home.
Original Mortgage
$53,000
Interest Rate
6.34%
Mortgage Type
Purchase Money Mortgage
Purchase Details
Closed on
Oct 25, 2004
Sold by
Schwab Dale W
Bought by
Schwab Dale W
Purchase Details
Closed on
Jan 1, 1986
Bought by
Schwab Dale W and Schwab Cindy L
Create a Home Valuation Report for This Property
The Home Valuation Report is an in-depth analysis detailing your home's value as well as a comparison with similar homes in the area
Home Values in the Area
Average Home Value in this Area
Purchase History
| Date | Buyer | Sale Price | Title Company |
|---|---|---|---|
| Villa Rental Properties Llc | $143,000 | None Available | |
| Gantzer Gregory R | $11,000 | None Available | |
| Beyer Sheila | $53,100 | Tower City Title Agency Llc | |
| Schwab Dale W | -- | -- | |
| Schwab Dale W | -- | -- |
Source: Public Records
Mortgage History
| Date | Status | Borrower | Loan Amount |
|---|---|---|---|
| Open | Villa Rental Properties Llc | $128,000 | |
| Previous Owner | Beyer Sheila | $53,000 |
Source: Public Records
Tax History Compared to Growth
Tax History
| Year | Tax Paid | Tax Assessment Tax Assessment Total Assessment is a certain percentage of the fair market value that is determined by local assessors to be the total taxable value of land and additions on the property. | Land | Improvement |
|---|---|---|---|---|
| 2024 | $526 | $12,490 | $1,200 | $11,290 |
| 2023 | $455 | $9,920 | $990 | $8,930 |
| 2022 | $455 | $9,918 | $990 | $8,928 |
| 2021 | $453 | $9,918 | $990 | $8,928 |
| 2020 | $425 | $8,630 | $860 | $7,770 |
| 2019 | $427 | $8,630 | $860 | $7,770 |
| 2018 | $370 | $8,630 | $860 | $7,770 |
| 2017 | $332 | $6,770 | $1,210 | $5,560 |
| 2016 | $337 | $6,770 | $1,210 | $5,560 |
| 2015 | $305 | $6,770 | $1,210 | $5,560 |
| 2014 | $386 | $8,510 | $1,100 | $7,410 |
| 2013 | $536 | $8,510 | $1,100 | $7,410 |
Source: Public Records
Map
Nearby Homes
- 600 N Zane Hwy
- 433 N Zane Hwy
- 425 N Zane Hwy
- 1105 N 6th St
- 212 N 7th St
- 37 N 4th St
- 841 Seabrights Ln
- 1408 N 9th St
- 910 Carlisle St
- 424 Elm St
- 415 Richland Ave
- 437 Richland Ave
- 629 Tulip Ln
- 101 N 7th St
- 340 W Cardinal Ave
- 101 N 8th St
- 722 Broadway St
- 69 E Cardinal Ave
- 725 S 4th St
- 58841 Glenns Run Rd