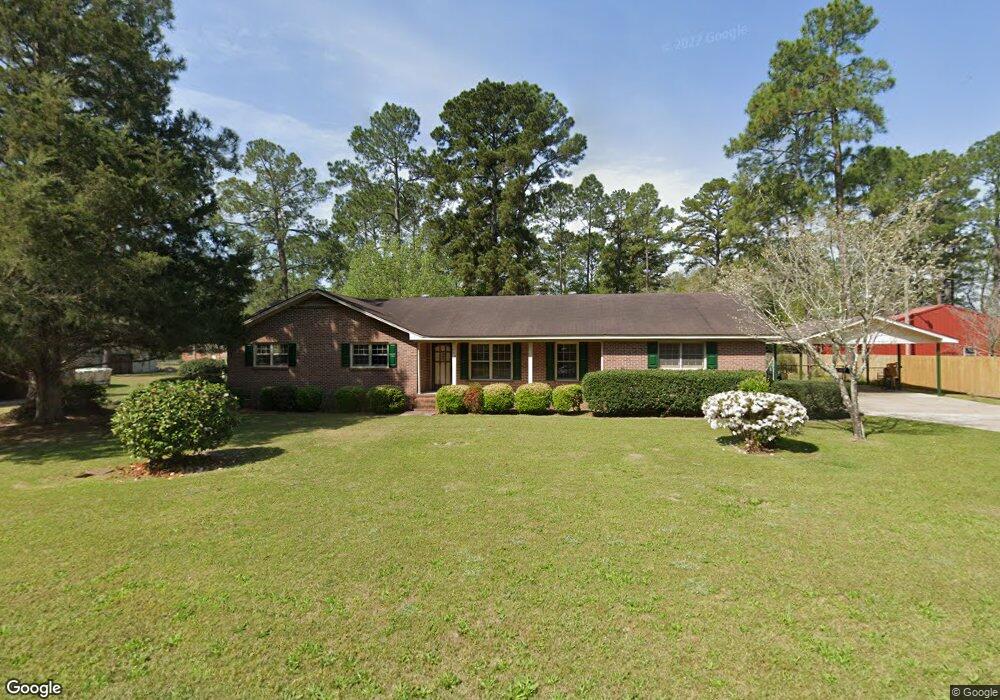
703 N Bay St Cordele, GA 31015
Estimated Value: $126,000 - $175,000
3
Beds
2
Baths
1,684
Sq Ft
$90/Sq Ft
Est. Value
About This Home
This home is located at 703 N Bay St, Cordele, GA 31015 and is currently estimated at $151,331, approximately $89 per square foot. 703 N Bay St is a home located in Crisp County with nearby schools including Crisp County Elementary School, Crisp County Primary School, and Crisp County Middle School.
Ownership History
Date
Name
Owned For
Owner Type
Purchase Details
Closed on
Jun 30, 2022
Sold by
Black Mary Geraldine
Bought by
Perez Flordilia Ester
Current Estimated Value
Home Financials for this Owner
Home Financials are based on the most recent Mortgage that was taken out on this home.
Original Mortgage
$90,000
Outstanding Balance
$83,338
Interest Rate
5.09%
Mortgage Type
Mortgage Modification
Estimated Equity
$67,993
Purchase Details
Closed on
Apr 16, 2001
Sold by
Black A L
Bought by
Black Mary Geraldine
Purchase Details
Closed on
Aug 2, 1989
Sold by
Pender David and Pender Kathrn
Bought by
Black A L
Purchase Details
Closed on
Apr 28, 1986
Bought by
Pender David and Pender Kathrn
Create a Home Valuation Report for This Property
The Home Valuation Report is an in-depth analysis detailing your home's value as well as a comparison with similar homes in the area
Home Values in the Area
Average Home Value in this Area
Purchase History
| Date | Buyer | Sale Price | Title Company |
|---|---|---|---|
| Perez Flordilia Ester | $100,000 | -- | |
| Black Mary Geraldine | -- | -- | |
| Black A L | $56,500 | -- | |
| Pender David | $52,000 | -- |
Source: Public Records
Mortgage History
| Date | Status | Borrower | Loan Amount |
|---|---|---|---|
| Open | Perez Flordilia Ester | $90,000 |
Source: Public Records
Tax History Compared to Growth
Tax History
| Year | Tax Paid | Tax Assessment Tax Assessment Total Assessment is a certain percentage of the fair market value that is determined by local assessors to be the total taxable value of land and additions on the property. | Land | Improvement |
|---|---|---|---|---|
| 2025 | $1,833 | $56,338 | $5,000 | $51,338 |
| 2024 | $1,833 | $51,139 | $5,000 | $46,139 |
| 2023 | $1,736 | $46,309 | $2,500 | $43,809 |
| 2022 | $738 | $43,710 | $2,500 | $41,210 |
| 2021 | $723 | $41,110 | $2,500 | $38,610 |
| 2020 | $710 | $41,110 | $2,500 | $38,610 |
| 2019 | $715 | $41,110 | $2,500 | $38,610 |
| 2018 | $508 | $33,143 | $3,750 | $29,393 |
| 2017 | $1,346 | $33,143 | $3,750 | $29,393 |
| 2016 | $510 | $33,143 | $3,750 | $29,393 |
| 2015 | -- | $33,143 | $3,750 | $29,393 |
| 2014 | -- | $33,143 | $3,750 | $29,393 |
| 2013 | -- | $33,143 | $3,750 | $29,393 |
Source: Public Records
Map
Nearby Homes