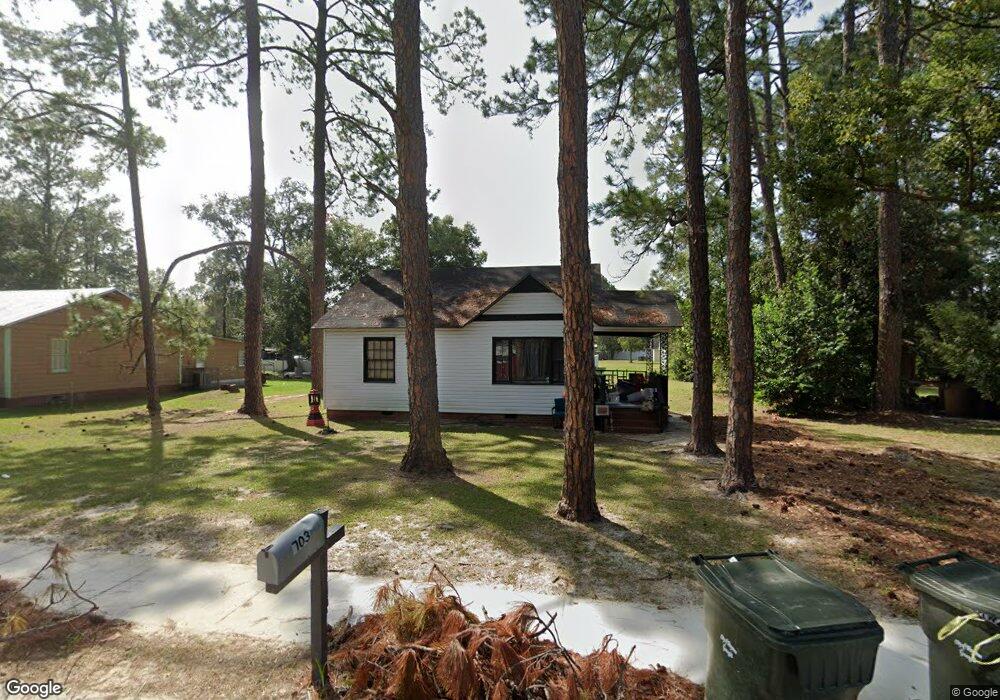
703 N Crawford St Waycross, GA 31503
Estimated Value: $60,307 - $85,000
--
Bed
1
Bath
880
Sq Ft
$86/Sq Ft
Est. Value
About This Home
This home is located at 703 N Crawford St, Waycross, GA 31503 and is currently estimated at $75,827, approximately $86 per square foot. 703 N Crawford St is a home located in Ware County with nearby schools including Waresboro Elementary School, Ware County Middle School, and Ware County High School.
Ownership History
Date
Name
Owned For
Owner Type
Purchase Details
Closed on
Aug 8, 2022
Sold by
Welch Lewis J
Bought by
L J Welch & Associates Inc
Current Estimated Value
Purchase Details
Closed on
Sep 24, 2021
Sold by
Walker Lynda Gayle
Bought by
Welch Lewis J
Purchase Details
Closed on
Jan 20, 2021
Sold by
Phillips Charles C
Bought by
Walker Lynda Gayle
Purchase Details
Closed on
Sep 9, 2020
Sold by
City Of Waycross
Bought by
Feagin Jeffery M and Feagin Shari P
Purchase Details
Closed on
Sep 30, 2010
Sold by
Bruce Alta P
Bought by
Phillips Charles C
Purchase Details
Closed on
Oct 14, 1996
Sold by
Bruce Alta P
Bought by
Cooper Gregory and Cooper Irene
Purchase Details
Closed on
Dec 17, 1993
Bought by
Bruce Alta P
Purchase Details
Closed on
Aug 11, 1992
Bought by
Hayes Gregory and Hayes Debo
Purchase Details
Closed on
Jan 1, 1985
Create a Home Valuation Report for This Property
The Home Valuation Report is an in-depth analysis detailing your home's value as well as a comparison with similar homes in the area
Home Values in the Area
Average Home Value in this Area
Purchase History
| Date | Buyer | Sale Price | Title Company |
|---|---|---|---|
| L J Welch & Associates Inc | -- | -- | |
| Welch Lewis J | $17,500 | -- | |
| Walker Lynda Gayle | -- | -- | |
| Feagin Jeffery M | -- | -- | |
| Huff Grady Charles | -- | -- | |
| Phillips Charles C | -- | -- | |
| Cooper Gregory | $24,900 | -- | |
| Bruce Alta P | $21,900 | -- | |
| Hayes Gregory | $23,900 | -- | |
| -- | $24,000 | -- |
Source: Public Records
Tax History Compared to Growth
Tax History
| Year | Tax Paid | Tax Assessment Tax Assessment Total Assessment is a certain percentage of the fair market value that is determined by local assessors to be the total taxable value of land and additions on the property. | Land | Improvement |
|---|---|---|---|---|
| 2024 | $515 | $13,586 | $1,702 | $11,884 |
| 2023 | $468 | $11,816 | $1,202 | $10,614 |
| 2022 | $279 | $7,000 | $974 | $6,026 |
| 2021 | $445 | $10,292 | $1,202 | $9,090 |
| 2020 | $440 | $10,102 | $1,150 | $8,952 |
| 2019 | $370 | $8,380 | $1,150 | $7,230 |
| 2018 | $359 | $8,036 | $1,150 | $6,886 |
| 2017 | $350 | $8,036 | $1,150 | $6,886 |
| 2016 | $350 | $8,036 | $1,150 | $6,886 |
| 2015 | $353 | $8,036 | $1,150 | $6,886 |
| 2014 | $352 | $8,036 | $1,150 | $6,886 |
| 2013 | -- | $9,415 | $1,150 | $8,265 |
Source: Public Records
Map
Nearby Homes
- 00 Roosevelt St
- 1401 Carswell Ave
- 605 Walker St
- 0 Camp Branch Cross Rd Unit 12958956
- 0 Camp Branch Cross Rd Unit 147575
- 0 Camp Branch Cross Rd Unit 10127958
- 6905 Kendal Ct
- 1006 Roosevelt St
- 601 N Nicholls St
- 1322 Jane St
- 1003 Carswell Ave
- 505 N Nicholls St
- 503 N Nicholls St
- 0 S Georgia Pkwy W
- 1208 Margaret St
- 506 McDonald St
- 1027 Robert St
- 629 Remshart St
- 516 Folks St
- 1103 Ann St
- 705 N Crawford St
- 701 N Crawford St
- 1404 Roosevelt St
- 1405 Ketterer St
- 704 N Crawford St
- 1326 Roosevelt St
- 613 N Crawford St
- 1408 Roosevelt St
- 1409 Ketterer St
- 00 Ketterer Street Lot
- 1323 Ketterer St
- 1324 Roosevelt St
- 1411 Roosevelt St
- 611 N Crawford St
- 1410 Roosevelt St
- 612 N Crawford St
- 1324 Ketterer St
- 1321 Ketterer St
- 1413 Ketterer St
- 1321 Roosevelt St