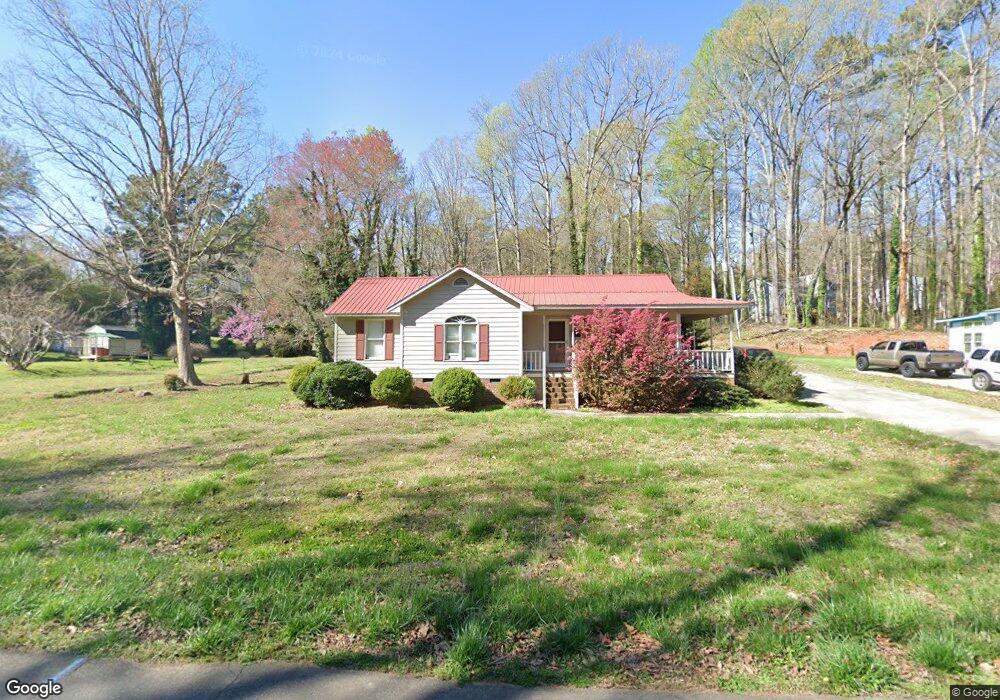
703 N Fir Ave Siler City, NC 27344
Estimated Value: $203,000 - $218,623
3
Beds
2
Baths
1,264
Sq Ft
$166/Sq Ft
Est. Value
About This Home
This home is located at 703 N Fir Ave, Siler City, NC 27344 and is currently estimated at $209,906, approximately $166 per square foot. 703 N Fir Ave is a home located in Chatham County with nearby schools including Siler City Elementary School, Chatham Middle, and Jordan Matthews High.
Ownership History
Date
Name
Owned For
Owner Type
Purchase Details
Closed on
May 14, 2019
Sold by
Custer Gary A and Custer Tracey
Bought by
Custer Sean Michael
Current Estimated Value
Home Financials for this Owner
Home Financials are based on the most recent Mortgage that was taken out on this home.
Original Mortgage
$132,000
Outstanding Balance
$117,351
Interest Rate
4.87%
Mortgage Type
Adjustable Rate Mortgage/ARM
Estimated Equity
$92,555
Purchase Details
Closed on
Apr 19, 2017
Sold by
Nobles Verna T
Bought by
Custer Blaine G
Purchase Details
Closed on
Sep 27, 2010
Sold by
Golden Richard S and Golden Kelly M
Bought by
Nobles Danny L and Nobles Verna T
Home Financials for this Owner
Home Financials are based on the most recent Mortgage that was taken out on this home.
Original Mortgage
$68,000
Interest Rate
4.42%
Mortgage Type
New Conventional
Create a Home Valuation Report for This Property
The Home Valuation Report is an in-depth analysis detailing your home's value as well as a comparison with similar homes in the area
Home Values in the Area
Average Home Value in this Area
Purchase History
| Date | Buyer | Sale Price | Title Company |
|---|---|---|---|
| Custer Sean Michael | $132,000 | None Available | |
| Custer Blaine G | $115,000 | Attorney | |
| Nobles Danny L | $85,000 | None Available |
Source: Public Records
Mortgage History
| Date | Status | Borrower | Loan Amount |
|---|---|---|---|
| Open | Custer Sean Michael | $132,000 | |
| Previous Owner | Nobles Danny L | $68,000 |
Source: Public Records
Tax History Compared to Growth
Tax History
| Year | Tax Paid | Tax Assessment Tax Assessment Total Assessment is a certain percentage of the fair market value that is determined by local assessors to be the total taxable value of land and additions on the property. | Land | Improvement |
|---|---|---|---|---|
| 2025 | $2,164 | $167,350 | $18,550 | $148,800 |
| 2024 | $2,164 | $111,491 | $11,415 | $100,076 |
| 2023 | $1,410 | $111,491 | $11,415 | $100,076 |
| 2022 | $1,343 | $111,491 | $11,415 | $100,076 |
| 2021 | $1,343 | $111,491 | $11,415 | $100,076 |
| 2020 | $1,159 | $95,779 | $13,530 | $82,249 |
| 2019 | $1,159 | $95,779 | $13,530 | $82,249 |
| 2018 | $1,090 | $95,779 | $13,530 | $82,249 |
| 2017 | $1,090 | $95,779 | $13,530 | $82,249 |
| 2016 | $1,300 | $116,744 | $16,500 | $100,244 |
| 2015 | $1,286 | $112,652 | $16,500 | $96,152 |
| 2014 | $1,241 | $112,652 | $16,500 | $96,152 |
| 2013 | -- | $112,652 | $16,500 | $96,152 |
Source: Public Records
Map
Nearby Homes
- 803 Woodland Dr
- 806 Cliftwood Dr
- Tbd W 3rd St
- 519 W Raleigh St
- 1007 Driftwood Dr
- 0 W 3rd St
- 1004 Candlewood Cir
- 1306 Sunset Dr
- 1707 N Chatham Ave
- 303 W Dolphin St
- 1501 Duet Dr
- 513 W Glendale St
- 409 E 10th St
- 128 Olde Manor Ct
- TBD E 3rd St
- 701 S Chatham Ave
- 726 S 2nd Ave
- 00 U S Highway 64
- 17880 U S Highway 64
- 2200 W 3rd St