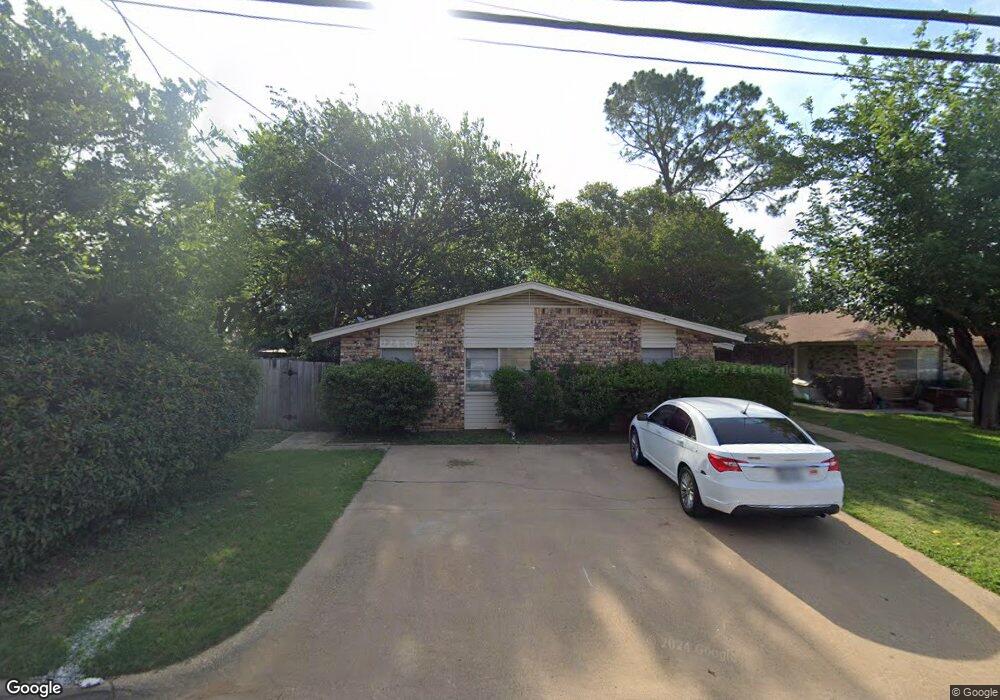
703 N Oak St Unit B Arlington, TX 76011
North Central Arlington NeighborhoodEstimated Value: $304,000 - $5,208,593
4
Beds
2
Baths
1,792
Sq Ft
$870/Sq Ft
Est. Value
About This Home
This home is located at 703 N Oak St Unit B, Arlington, TX 76011 and is currently estimated at $1,559,898, approximately $870 per square foot. 703 N Oak St Unit B is a home located in Tarrant County with nearby schools including Speer Elementary School, Shackelford J High School, and Lamar High School.
Ownership History
Date
Name
Owned For
Owner Type
Purchase Details
Closed on
Mar 27, 2020
Sold by
Motsenbocker Ami J and Motsenbocker Brett Holli
Bought by
M2html Llc
Current Estimated Value
Purchase Details
Closed on
Nov 6, 1997
Sold by
Duncan Marguerite
Bought by
Harry Joe E and Harry Patricia G
Create a Home Valuation Report for This Property
The Home Valuation Report is an in-depth analysis detailing your home's value as well as a comparison with similar homes in the area
Home Values in the Area
Average Home Value in this Area
Purchase History
| Date | Buyer | Sale Price | Title Company |
|---|---|---|---|
| M2html Llc | -- | None Available | |
| Motsenbocker Ami J | -- | None Available | |
| Harry Joe E | -- | -- |
Source: Public Records
Tax History Compared to Growth
Tax History
| Year | Tax Paid | Tax Assessment Tax Assessment Total Assessment is a certain percentage of the fair market value that is determined by local assessors to be the total taxable value of land and additions on the property. | Land | Improvement |
|---|---|---|---|---|
| 2025 | $3,687 | $151,099 | $10,500 | $140,599 |
| 2024 | $3,687 | $181,000 | $10,500 | $170,500 |
| 2023 | $3,687 | $167,077 | $10,500 | $156,577 |
| 2022 | $3,753 | $150,916 | $10,500 | $140,416 |
| 2021 | $3,061 | $117,810 | $10,500 | $107,310 |
| 2020 | $1,667 | $66,369 | $10,500 | $55,869 |
| 2019 | $1,751 | $67,391 | $10,500 | $56,891 |
| 2018 | $1,751 | $67,405 | $10,500 | $56,905 |
| 2017 | $1,821 | $68,409 | $10,500 | $57,909 |
| 2016 | $1,778 | $66,806 | $10,500 | $56,306 |
| 2015 | $1,965 | $74,500 | $10,500 | $64,000 |
| 2014 | $1,965 | $74,500 | $10,500 | $64,000 |
Source: Public Records
Map
Nearby Homes
- 610 N Pecan St Unit A&B
- 806 N Center St
- 608 W Sanford St
- 111 E Rogers St
- 601 Alaska St
- 908 Marcellus Ct
- 519 Taylor St
- 608 N East St
- 5675 Taylor Trail
- 5667 Scotsman Trail
- 5671 Taylor Trail
- 5655 Scotsman Trail
- 5656 Taylor Trail
- 5679 Taylor Trail
- 5664 Taylor Trail
- 5660 Taylor Trail
- 5652 Taylor Trail
- 818 E Rogers St
- 610 E Sanford St
- 415 N East St Unit 146
- 703 N Oak St Unit A
- 617 N Oak St
- 611 N Oak St
- 611 N Oak St Unit B
- 611 N Oak St Unit A, B
- 709 N Oak St
- 609 N Oak St
- 704 N Pecan St
- 704 N Pecan St Unit B
- 706 N Pecan St Unit A
- 702 N Pecan St
- 702 N Pecan St Unit B
- 708 N Pecan St
- 700 N Pecan St
- 708 N Oak St
- 711 N Oak St
- 616 N Oak St
- 607 N Oak St
- 607 N Oak St Unit B
- 607 A N Oak St N