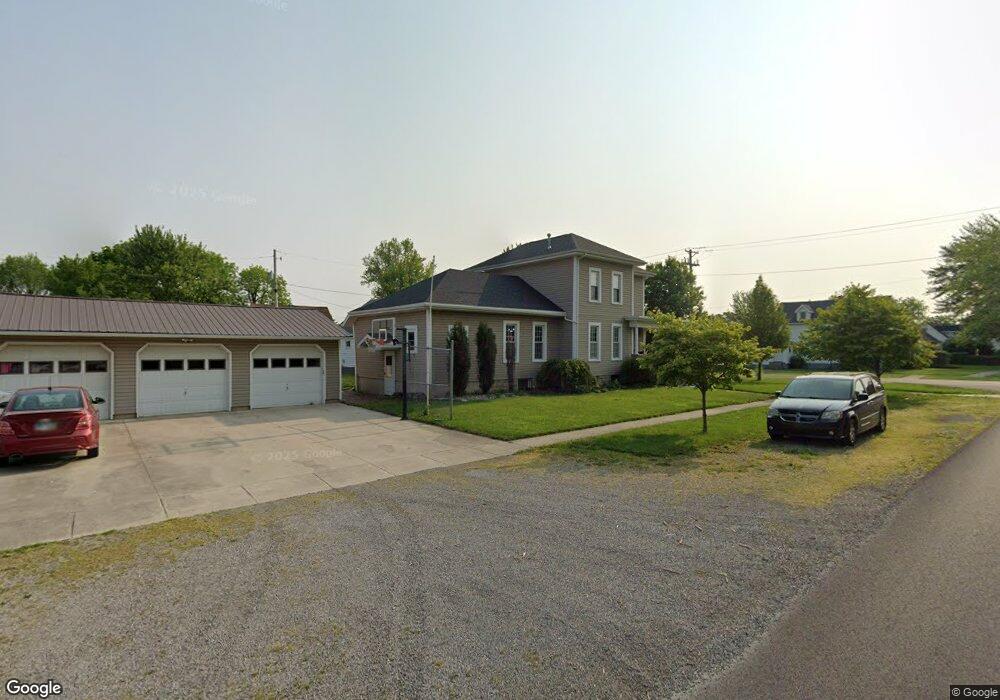
703 N Pierce St Delphos, OH 45833
Estimated Value: $197,000 - $305,000
4
Beds
2
Baths
1,936
Sq Ft
$128/Sq Ft
Est. Value
About This Home
This home is located at 703 N Pierce St, Delphos, OH 45833 and is currently estimated at $247,287, approximately $127 per square foot. 703 N Pierce St is a home located in Allen County with nearby schools including Delphos St. John's High School and Delphos St. John's Elementary School.
Ownership History
Date
Name
Owned For
Owner Type
Purchase Details
Closed on
Sep 9, 2019
Sold by
Pseekos Thomas J
Bought by
Pavel Albert G and Pavel Linda S
Current Estimated Value
Home Financials for this Owner
Home Financials are based on the most recent Mortgage that was taken out on this home.
Original Mortgage
$175,750
Outstanding Balance
$154,258
Interest Rate
3.7%
Mortgage Type
Purchase Money Mortgage
Estimated Equity
$93,029
Purchase Details
Closed on
Feb 5, 2019
Sold by
Pseekos Jessica L
Bought by
Pseekos Thomas J
Purchase Details
Closed on
Jul 17, 2007
Sold by
Rostorfer Timothy J and Rostorfer Diane R
Bought by
Pseekos Thomas J and Pseekos Jessica L
Home Financials for this Owner
Home Financials are based on the most recent Mortgage that was taken out on this home.
Original Mortgage
$115,000
Interest Rate
6.73%
Mortgage Type
New Conventional
Purchase Details
Closed on
Jul 11, 1996
Sold by
Kimmett Helen
Bought by
Rostorfer Timothy and Rostorfer Diane
Purchase Details
Closed on
Aug 2, 1990
Bought by
Kimmett Helen I
Create a Home Valuation Report for This Property
The Home Valuation Report is an in-depth analysis detailing your home's value as well as a comparison with similar homes in the area
Home Values in the Area
Average Home Value in this Area
Purchase History
| Date | Buyer | Sale Price | Title Company |
|---|---|---|---|
| Pavel Albert G | $185,000 | None Available | |
| Pseekos Thomas J | -- | None Available | |
| Pseekos Thomas J | $130,000 | None Available | |
| Rostorfer Timothy | $30,000 | -- | |
| Kimmett Helen I | -- | -- |
Source: Public Records
Mortgage History
| Date | Status | Borrower | Loan Amount |
|---|---|---|---|
| Open | Pavel Albert G | $175,750 | |
| Closed | Pseekos Thomas J | $115,000 |
Source: Public Records
Tax History Compared to Growth
Tax History
| Year | Tax Paid | Tax Assessment Tax Assessment Total Assessment is a certain percentage of the fair market value that is determined by local assessors to be the total taxable value of land and additions on the property. | Land | Improvement |
|---|---|---|---|---|
| 2024 | $2,661 | $86,630 | $7,180 | $79,450 |
| 2023 | $2,091 | $64,650 | $5,360 | $59,290 |
| 2022 | $2,143 | $64,650 | $5,360 | $59,290 |
| 2021 | $2,153 | $64,650 | $5,360 | $59,290 |
| 2020 | $1,623 | $50,790 | $5,110 | $45,680 |
| 2019 | $1,623 | $50,790 | $5,110 | $45,680 |
| 2018 | $1,582 | $50,790 | $5,110 | $45,680 |
| 2017 | $1,514 | $46,620 | $5,110 | $41,510 |
| 2016 | $1,527 | $46,620 | $5,110 | $41,510 |
| 2015 | $1,407 | $46,620 | $5,110 | $41,510 |
| 2014 | $1,407 | $42,560 | $4,900 | $37,660 |
| 2013 | $1,412 | $42,560 | $4,900 | $37,660 |
Source: Public Records
Map
Nearby Homes
- 704 N Franklin St
- 810 N Franklin St
- 610 N Washington St
- 405 N Franklin St
- 210 E 3rd St
- 521 Carolyn Dr
- 633 E 2nd St
- 604 W 6th St
- 409 N Bredeick St
- 1303 Carolyn Dr
- 221 S Main St
- 1220 Rose Anna Dr
- 424 S Canal St
- 483 S Franklin St
- 516 S Main St
- 634 S Clay St
- 827 S Washington St
- 7110 Elida Rd
- 1400 S Clay St Unit 17
- 11630 Clearview Dr