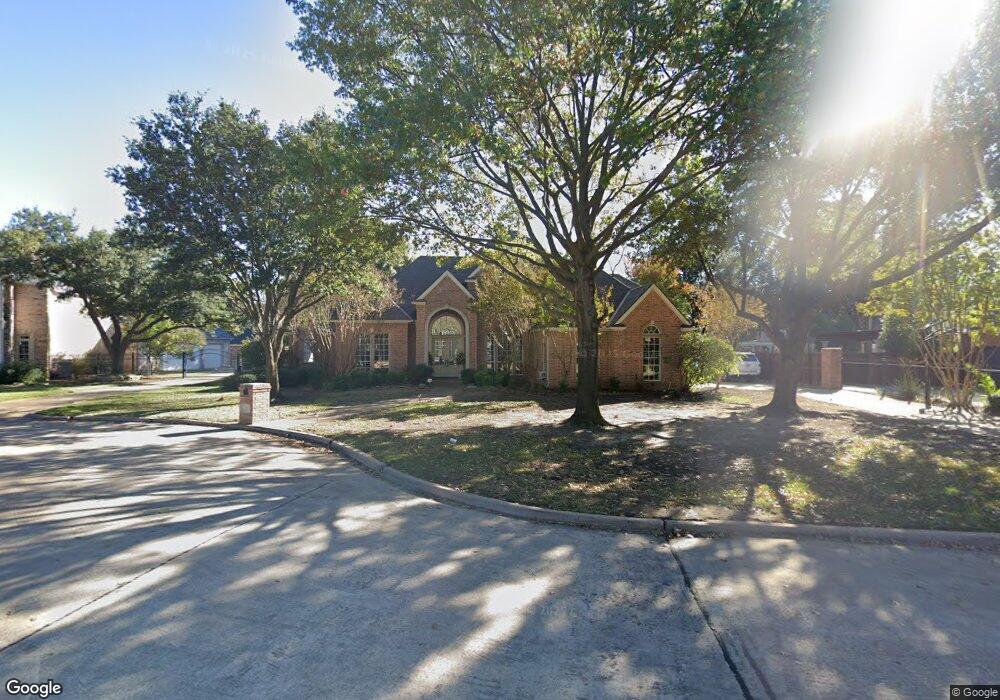
703 Prince George Ct Southlake, TX 76092
Estimated Value: $1,280,431 - $1,462,000
4
Beds
5
Baths
4,167
Sq Ft
$337/Sq Ft
Est. Value
About This Home
This home is located at 703 Prince George Ct, Southlake, TX 76092 and is currently estimated at $1,405,358, approximately $337 per square foot. 703 Prince George Ct is a home located in Tarrant County with nearby schools including Carroll Elementary School, Eubanks Intermediate School, and George Dawson Middle School.
Ownership History
Date
Name
Owned For
Owner Type
Purchase Details
Closed on
May 24, 2023
Sold by
Nohe Richard E and Nohe Doris
Bought by
Lamora Justin D and Flam Jennifer S
Current Estimated Value
Home Financials for this Owner
Home Financials are based on the most recent Mortgage that was taken out on this home.
Original Mortgage
$680,000
Outstanding Balance
$660,675
Interest Rate
6.27%
Mortgage Type
New Conventional
Estimated Equity
$744,683
Purchase Details
Closed on
Jun 27, 2016
Sold by
Murphy Joseph F and Murphy Wendy W
Bought by
Nohe Richard E and Lopez Nohe Doris
Home Financials for this Owner
Home Financials are based on the most recent Mortgage that was taken out on this home.
Original Mortgage
$548,000
Interest Rate
3.37%
Mortgage Type
Adjustable Rate Mortgage/ARM
Purchase Details
Closed on
Dec 16, 2011
Sold by
Armstrong John and Armstrong Carrie
Bought by
Murphy Joseph F and Murphy Wendy W
Home Financials for this Owner
Home Financials are based on the most recent Mortgage that was taken out on this home.
Original Mortgage
$415,000
Interest Rate
4.03%
Mortgage Type
New Conventional
Purchase Details
Closed on
Jun 16, 2006
Sold by
Nelson Michael W and Nelson Kathleen K
Bought by
Armstrong John and Armstrong Carrie
Home Financials for this Owner
Home Financials are based on the most recent Mortgage that was taken out on this home.
Original Mortgage
$275,000
Interest Rate
6.56%
Mortgage Type
Fannie Mae Freddie Mac
Purchase Details
Closed on
Mar 24, 2000
Sold by
Macgibbon Kendall S and Macgibbon Kathy L
Bought by
Nelson Michael W and Nelson Kathleen K
Home Financials for this Owner
Home Financials are based on the most recent Mortgage that was taken out on this home.
Original Mortgage
$275,000
Interest Rate
8.66%
Purchase Details
Closed on
Jun 2, 1998
Sold by
Overstreet William D and Overstreet Vikki M
Bought by
Macgibbon Kendall S and Macgibbon Kathy L
Home Financials for this Owner
Home Financials are based on the most recent Mortgage that was taken out on this home.
Original Mortgage
$356,450
Interest Rate
7.2%
Purchase Details
Closed on
Dec 13, 1993
Sold by
Grande Custom Homes
Bought by
Overstreet William D and Overstreet Vikki M
Home Financials for this Owner
Home Financials are based on the most recent Mortgage that was taken out on this home.
Original Mortgage
$70,300
Interest Rate
7.06%
Create a Home Valuation Report for This Property
The Home Valuation Report is an in-depth analysis detailing your home's value as well as a comparison with similar homes in the area
Home Values in the Area
Average Home Value in this Area
Purchase History
| Date | Buyer | Sale Price | Title Company |
|---|---|---|---|
| Lamora Justin D | -- | Chicago Title | |
| Nohe Richard E | -- | Attorney | |
| Murphy Joseph F | -- | Fnt | |
| Armstrong John | -- | First American Title | |
| Nelson Michael W | -- | First American Title Co | |
| Macgibbon Kendall S | -- | Rattikin Title Co | |
| Overstreet William D | -- | Safeco Land Title |
Source: Public Records
Mortgage History
| Date | Status | Borrower | Loan Amount |
|---|---|---|---|
| Open | Lamora Justin D | $680,000 | |
| Previous Owner | Nohe Richard E | $548,000 | |
| Previous Owner | Murphy Joseph F | $415,000 | |
| Previous Owner | Armstrong John | $275,000 | |
| Previous Owner | Nelson Michael W | $275,000 | |
| Previous Owner | Macgibbon Kendall S | $356,450 | |
| Previous Owner | Overstreet William D | $70,300 | |
| Closed | Overstreet William D | $433,000 |
Source: Public Records
Tax History Compared to Growth
Tax History
| Year | Tax Paid | Tax Assessment Tax Assessment Total Assessment is a certain percentage of the fair market value that is determined by local assessors to be the total taxable value of land and additions on the property. | Land | Improvement |
|---|---|---|---|---|
| 2025 | $15,780 | $1,038,000 | $344,625 | $693,375 |
| 2024 | $15,780 | $1,038,000 | $344,625 | $693,375 |
| 2023 | $14,991 | $1,126,625 | $344,625 | $782,000 |
| 2022 | $16,131 | $1,029,542 | $229,750 | $799,792 |
| 2021 | $15,498 | $679,748 | $229,750 | $449,998 |
| 2020 | $14,324 | $623,178 | $206,775 | $416,403 |
| 2019 | $17,190 | $710,000 | $175,000 | $535,000 |
| 2018 | $14,705 | $645,346 | $150,000 | $495,346 |
| 2017 | $16,651 | $671,797 | $150,000 | $521,797 |
| 2016 | $16,195 | $683,355 | $150,000 | $533,355 |
| 2015 | $14,386 | $594,000 | $65,000 | $529,000 |
| 2014 | $14,386 | $617,800 | $65,000 | $552,800 |
Source: Public Records
Map
Nearby Homes
- 900 Kingsbury Way
- 1196 W Continental Blvd
- 802 Princeton Ct
- 7607 Monticello Pkwy
- 7702 Tillman Hill Rd
- 1206 Oakwood Trail
- 7511 Mount Vernon Dr
- 7400 John Mccain Rd
- 608 Stratford Dr
- 1002 Chimney Hill Trail
- 800 Woodcrest Ct
- 806 Shadow Glen Dr
- 305 Canyon Lake Dr
- 1205 Scenic Dr
- 7212 John Mccain Rd
- 7312 Hix Ct
- 806 Ridgedale Ct
- 1227 Strathmore Dr
- 7115 Cast Iron Forest Trail
- 205 Edinburgh Ct
- 701 Prince George Ct
- 800 Potomac Place
- 802 Potomac Place
- 704 Sutton Mill Ct
- 702 Sutton Mill Ct
- 706 Sutton Mill Ct
- 700 Prince George Ct
- 704 Prince George Ct
- 702 Prince George Ct
- 605 Vicksburg Ct
- 706 Prince George Ct
- 608 Potomac Place
- 604 Vicksburg Ct
- 801 Potomac Place
- 700 Sutton Mill Ct
- 803 Potomac Place
- 705 Potomac Place
- 603 Vicksburg Ct
- 701 Sutton Mill Ct
- 805 Potomac Place