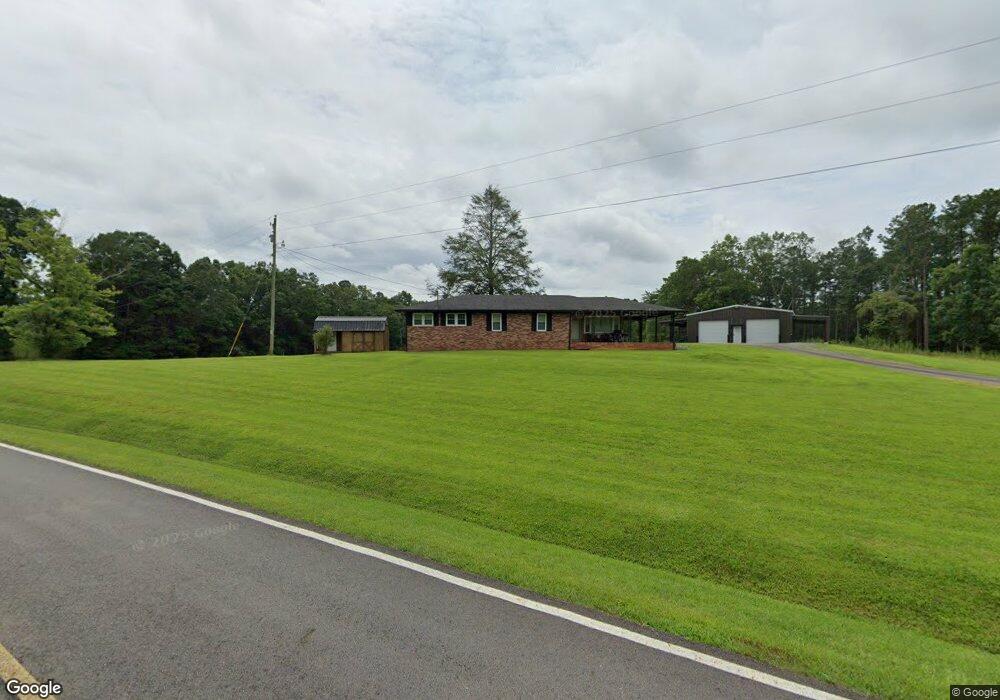
703 Roberts Ridge Rd Ellijay, GA 30540
Estimated Value: $321,000 - $423,000
3
Beds
1
Bath
1,538
Sq Ft
$235/Sq Ft
Est. Value
About This Home
This home is located at 703 Roberts Ridge Rd, Ellijay, GA 30540 and is currently estimated at $361,196, approximately $234 per square foot. 703 Roberts Ridge Rd is a home located in Gilmer County with nearby schools including Mountain View Elementary School, Clear Creek Middle School, and Gilmer High School.
Ownership History
Date
Name
Owned For
Owner Type
Purchase Details
Closed on
Oct 14, 2024
Sold by
Anderson Jeff H
Bought by
Anderson Sharon H
Current Estimated Value
Purchase Details
Closed on
Mar 4, 2011
Sold by
Newton Kenneth G
Bought by
Anderson Jeff H
Home Financials for this Owner
Home Financials are based on the most recent Mortgage that was taken out on this home.
Original Mortgage
$77,002
Interest Rate
4.77%
Mortgage Type
Future Advance Clause Open End Mortgage
Purchase Details
Closed on
Dec 7, 2010
Sold by
Newton Kenneth G and Ralston Rog
Bought by
Anderson Jeff H
Home Financials for this Owner
Home Financials are based on the most recent Mortgage that was taken out on this home.
Original Mortgage
$77,002
Interest Rate
4.77%
Mortgage Type
Future Advance Clause Open End Mortgage
Purchase Details
Closed on
Feb 1, 1998
Sold by
Newton Edward C
Bought by
Newton Kenneth G and Newton T
Create a Home Valuation Report for This Property
The Home Valuation Report is an in-depth analysis detailing your home's value as well as a comparison with similar homes in the area
Home Values in the Area
Average Home Value in this Area
Purchase History
| Date | Buyer | Sale Price | Title Company |
|---|---|---|---|
| Anderson Sharon H | -- | -- | |
| Anderson Jeff H | $125,000 | -- | |
| Anderson Jeff H | $125,000 | -- | |
| Ralston Roger E | $55,000 | -- | |
| Newton Kenneth G | -- | -- |
Source: Public Records
Mortgage History
| Date | Status | Borrower | Loan Amount |
|---|---|---|---|
| Previous Owner | Anderson Jeff H | $77,002 | |
| Previous Owner | Anderson Jeff H | $77,002 |
Source: Public Records
Tax History Compared to Growth
Tax History
| Year | Tax Paid | Tax Assessment Tax Assessment Total Assessment is a certain percentage of the fair market value that is determined by local assessors to be the total taxable value of land and additions on the property. | Land | Improvement |
|---|---|---|---|---|
| 2024 | $2,058 | $132,840 | $35,760 | $97,080 |
| 2023 | $2,001 | $125,120 | $28,040 | $97,080 |
| 2022 | $1,900 | $107,960 | $26,720 | $81,240 |
| 2021 | $1,779 | $89,640 | $23,440 | $66,200 |
| 2020 | $1,773 | $80,600 | $22,840 | $57,760 |
| 2019 | $1,392 | $61,480 | $22,840 | $38,640 |
| 2018 | $1,216 | $57,800 | $19,160 | $38,640 |
| 2017 | $1,165 | $49,240 | $19,160 | $30,080 |
| 2016 | $1,200 | $49,680 | $19,160 | $30,520 |
| 2015 | $1,201 | $51,120 | $19,120 | $32,000 |
| 2014 | $1,247 | $51,080 | $19,120 | $31,960 |
| 2013 | -- | $48,560 | $19,120 | $29,440 |
Source: Public Records
Map
Nearby Homes
- 37 Lafayette Dr
- 82 Thornwood Ct
- 1870 Chatsworth Hwy
- 2172 Tails Creek Rd
- 0 Tanglewood Ln Unit 10628463
- 0 Tanglewood Ln Unit 7665780
- 1304 Dalrymple Cir
- LT 17R Tanager Trail
- 0 High River Rd Unit 419208
- 0 Heritage Way Unit 10633723
- 0 Flat Ridge Rd Unit 10490565
- 0 Reece Mountain Rd Unit 7663580
- 10323 Grassy Mountain Rd
- 0 Flagpole Cir Unit 7404566
- 0 N Harris Creek Dr Unit 7637623
- 0 High River Rd Unit 10608415
- 136 Whispering Ridge Ct
- 0 Roaring Forks Ln Unit 420425
- 0 Flat Ridge Rd Unit 7551341
- 136 Whispering Ridge Ct Unit 136
- 10 Mystic Dr
- 581 Roberts Ridge Rd
- 576 Leonard Evans Rd
- 760 Roberts Ridge Rd
- 526 Leonard Evans Rd
- 68 Mystic Dr
- LT 15 Mystic Dr
- LT 7 Mystic Dr
- LT 14 Mystic Dr
- LOT 4 Mystic Dr
- 0 Mystic Dr Unit LOT 23 20143774
- 0 Mystic Dr
- 492 Roberts Ridge Rd
- 143 Burgess Rd
- 207 Lee Pritchett Rd
- 876 Roberts Ridge Rd
- 579 Roberts Ridge Rd
- 146 Mystic Ct
- 0 Lt 4 Mystic Dr
- 0 Lt 4 Mystic Dr Unit 313482