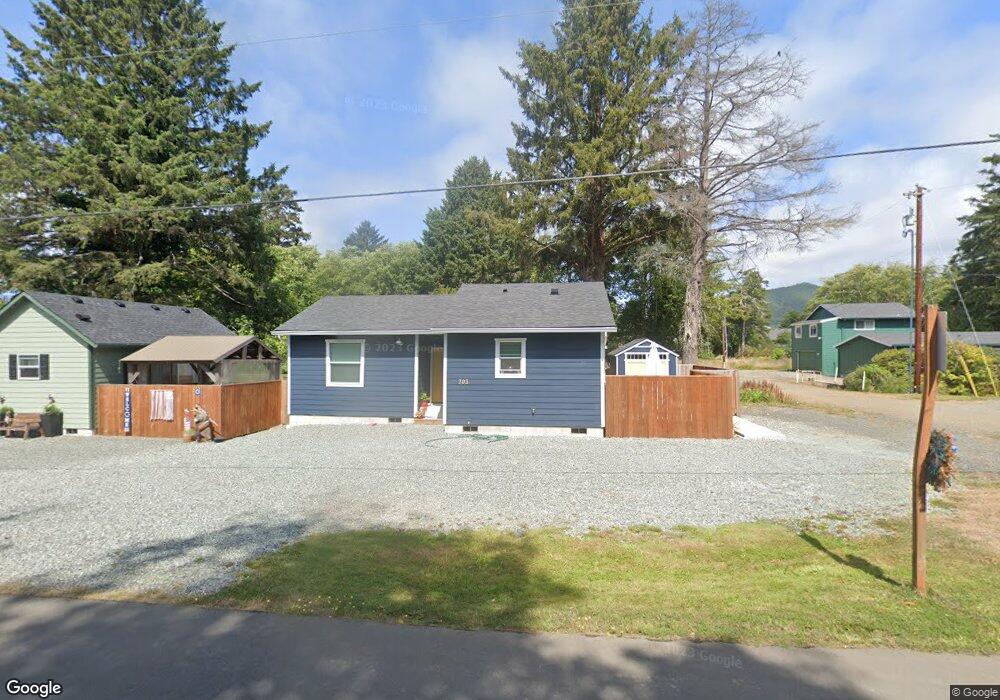
703 S 2nd Ave Rockaway Beach, OR 97136
Estimated Value: $315,000 - $430,000
2
Beds
1
Bath
865
Sq Ft
$430/Sq Ft
Est. Value
About This Home
This home is located at 703 S 2nd Ave, Rockaway Beach, OR 97136 and is currently estimated at $371,867, approximately $429 per square foot. 703 S 2nd Ave is a home located in Tillamook County with nearby schools including Garibaldi Elementary School, Nehalem Elementary School, and Neah-Kah-Nie Middle School.
Ownership History
Date
Name
Owned For
Owner Type
Purchase Details
Closed on
Mar 24, 2022
Sold by
Donald Aten
Bought by
Schaefbauer Shelby
Current Estimated Value
Home Financials for this Owner
Home Financials are based on the most recent Mortgage that was taken out on this home.
Original Mortgage
$332,500
Outstanding Balance
$312,361
Interest Rate
4.42%
Mortgage Type
New Conventional
Estimated Equity
$59,506
Purchase Details
Closed on
May 27, 2020
Sold by
Aten Donald and Aten Linda
Bought by
Aten Donald and Aten Linda
Purchase Details
Closed on
Nov 6, 2019
Sold by
Todd Patrick
Bought by
Aten Donald and Aten Linda
Purchase Details
Closed on
Jun 10, 2019
Sold by
Todd Judith K
Bought by
Judith Todd Revocable Living Trust
Purchase Details
Closed on
Sep 22, 2017
Sold by
Davidson William R
Bought by
Todd Judith K
Home Financials for this Owner
Home Financials are based on the most recent Mortgage that was taken out on this home.
Interest Rate
3.83%
Create a Home Valuation Report for This Property
The Home Valuation Report is an in-depth analysis detailing your home's value as well as a comparison with similar homes in the area
Home Values in the Area
Average Home Value in this Area
Purchase History
| Date | Buyer | Sale Price | Title Company |
|---|---|---|---|
| Schaefbauer Shelby | $350,000 | Ticor Title | |
| Aten Donald | -- | None Available | |
| Aten Donald | $75,000 | Ticor Title | |
| Judith Todd Revocable Living Trust | -- | None Available | |
| Todd Judith K | -- | -- |
Source: Public Records
Mortgage History
| Date | Status | Borrower | Loan Amount |
|---|---|---|---|
| Open | Schaefbauer Shelby | $332,500 | |
| Previous Owner | Todd Judith K | -- |
Source: Public Records
Tax History Compared to Growth
Tax History
| Year | Tax Paid | Tax Assessment Tax Assessment Total Assessment is a certain percentage of the fair market value that is determined by local assessors to be the total taxable value of land and additions on the property. | Land | Improvement |
|---|---|---|---|---|
| 2024 | $1,742 | $179,730 | $37,480 | $142,250 |
| 2023 | $1,734 | $174,500 | $36,390 | $138,110 |
| 2022 | $941 | $94,360 | $35,330 | $59,030 |
| 2021 | $337 | $34,310 | $34,310 | $0 |
| 2020 | $328 | $33,320 | $33,320 | $0 |
| 2019 | $494 | $50,160 | $50,160 | $0 |
| 2018 | $481 | $48,700 | $48,700 | $0 |
| 2017 | $940 | $93,800 | $43,750 | $50,050 |
| 2016 | $913 | $91,070 | $42,470 | $48,600 |
| 2015 | $898 | $88,420 | $41,240 | $47,180 |
| 2014 | $885 | $85,850 | $40,040 | $45,810 |
| 2013 | -- | $83,350 | $38,870 | $44,480 |
Source: Public Records
Map
Nearby Homes
- 0 S 2nd Ave
- 240 S Harbor St
- 407 S 2nd Ave
- 126 N Harbor St
- 185 S Coral St
- 283 S Dolphin St
- 367 S Longview Loop
- Lot 57 Pacific View Dr Unit TL3700
- 215 S Neptune St
- 186 S Neptune St
- 333 Pacific View Dr
- 270 N Dolphin St
- 277 N Dolphin St
- 0 S Longview Loop Unit 23324548
- 0 22870 Unit 710378544
- 115 N Miller St Unit 302
- 115 N Miller St Unit 303
- 701 S 2nd Ave
- 803 S 2nd Ave
- 151 S Harbor St
- 145 S Harbor St
- 176 S Harbor St
- 815 S 2nd Ave
- 187 S Grayling St
- 607 S 2nd Ave
- 175 S Grayling St
- 708 S 2nd Ave
- 608 S 2nd Ave
- 210 S Harbor St
- 830 S 2nd Ave
- 196 S Falcon St
- 176 S Falcon St
- 606 S 2nd Ave
- 141 S Harbor St
- 602 S 2nd Ave
- 206 S Falcon St
- 195 S Juniper St