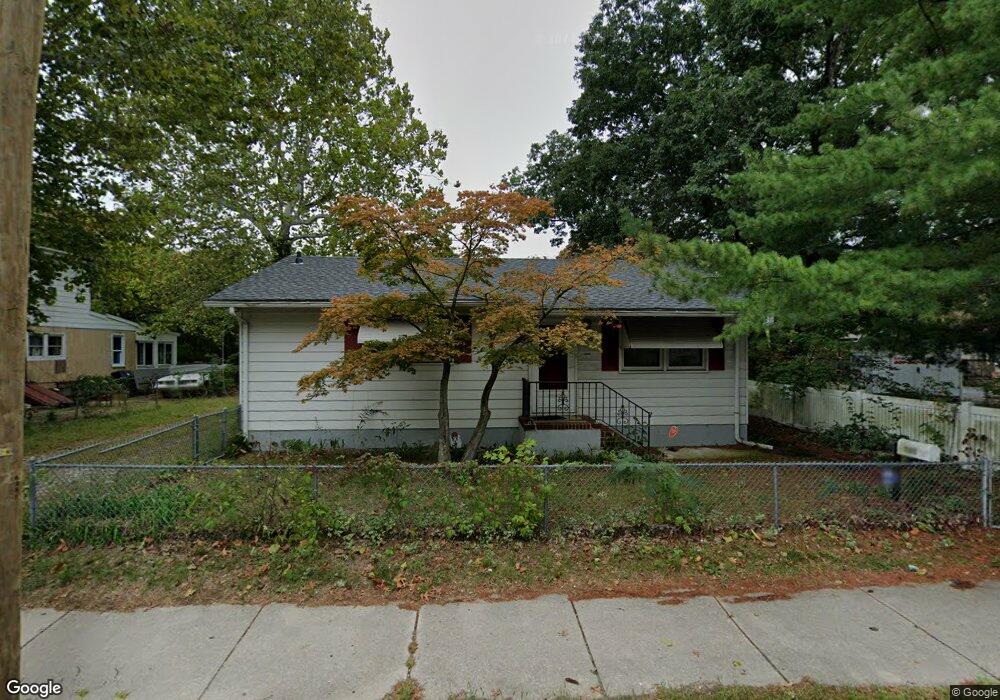
703 S 3rd St Millville, NJ 08332
Estimated Value: $183,000 - $227,000
3
Beds
1
Bath
936
Sq Ft
$223/Sq Ft
Est. Value
About This Home
This home is located at 703 S 3rd St, Millville, NJ 08332 and is currently estimated at $208,609, approximately $222 per square foot. 703 S 3rd St is a home located in Cumberland County with nearby schools including R.M. Bacon Elementary School, Lakeside Middle School, and Memorial High School.
Ownership History
Date
Name
Owned For
Owner Type
Purchase Details
Closed on
Jul 3, 2017
Sold by
Jones Michael and Johnson Christine
Bought by
Jones Ashley M
Current Estimated Value
Purchase Details
Closed on
May 31, 2017
Sold by
Jones Michael and Estate Of Mary M Corson Jones
Bought by
Jones Michael C and Johnson Christine
Purchase Details
Closed on
Sep 15, 2000
Sold by
Torres Miguel A
Bought by
Perez Carlos A
Home Financials for this Owner
Home Financials are based on the most recent Mortgage that was taken out on this home.
Original Mortgage
$61,968
Outstanding Balance
$22,537
Interest Rate
8.07%
Mortgage Type
FHA
Estimated Equity
$186,072
Purchase Details
Closed on
Sep 13, 2000
Sold by
Torres Miguel
Bought by
Perez Carlos
Home Financials for this Owner
Home Financials are based on the most recent Mortgage that was taken out on this home.
Original Mortgage
$61,968
Outstanding Balance
$22,537
Interest Rate
8.07%
Mortgage Type
FHA
Estimated Equity
$186,072
Purchase Details
Closed on
Jul 15, 1998
Sold by
Federal Housing Commissioner
Bought by
Torres Miguel A
Home Financials for this Owner
Home Financials are based on the most recent Mortgage that was taken out on this home.
Original Mortgage
$22,675
Interest Rate
6.98%
Purchase Details
Closed on
Jan 31, 1991
Bought by
Jones Mary
Create a Home Valuation Report for This Property
The Home Valuation Report is an in-depth analysis detailing your home's value as well as a comparison with similar homes in the area
Home Values in the Area
Average Home Value in this Area
Purchase History
| Date | Buyer | Sale Price | Title Company |
|---|---|---|---|
| Jones Ashley M | -- | None Available | |
| Jones Michael C | -- | None Available | |
| Perez Carlos A | $62,000 | -- | |
| Perez Carlos A | $62,000 | -- | |
| Perez Carlos | $62,000 | -- | |
| Torres Miguel A | $25,000 | -- | |
| Jones Mary | -- | -- |
Source: Public Records
Mortgage History
| Date | Status | Borrower | Loan Amount |
|---|---|---|---|
| Open | Perez Carlos A | $61,968 | |
| Closed | Perez Carlos A | $61,968 | |
| Closed | Perez Carlos | $61,968 | |
| Previous Owner | Torres Miguel A | $22,675 |
Source: Public Records
Tax History Compared to Growth
Tax History
| Year | Tax Paid | Tax Assessment Tax Assessment Total Assessment is a certain percentage of the fair market value that is determined by local assessors to be the total taxable value of land and additions on the property. | Land | Improvement |
|---|---|---|---|---|
| 2025 | $3,603 | $91,800 | $31,200 | $60,600 |
| 2024 | $3,603 | $91,800 | $31,200 | $60,600 |
| 2023 | $3,573 | $91,800 | $31,200 | $60,600 |
| 2022 | $3,480 | $91,800 | $31,200 | $60,600 |
| 2021 | $3,367 | $91,800 | $31,200 | $60,600 |
| 2020 | $3,311 | $91,800 | $31,200 | $60,600 |
| 2019 | $3,158 | $91,800 | $31,200 | $60,600 |
| 2018 | $3,093 | $91,800 | $31,200 | $60,600 |
| 2017 | $3,064 | $91,800 | $31,200 | $60,600 |
| 2016 | $3,026 | $91,800 | $31,200 | $60,600 |
| 2015 | $2,458 | $91,800 | $31,200 | $60,600 |
| 2014 | $2,463 | $91,800 | $31,200 | $60,600 |
Source: Public Records
Map
Nearby Homes