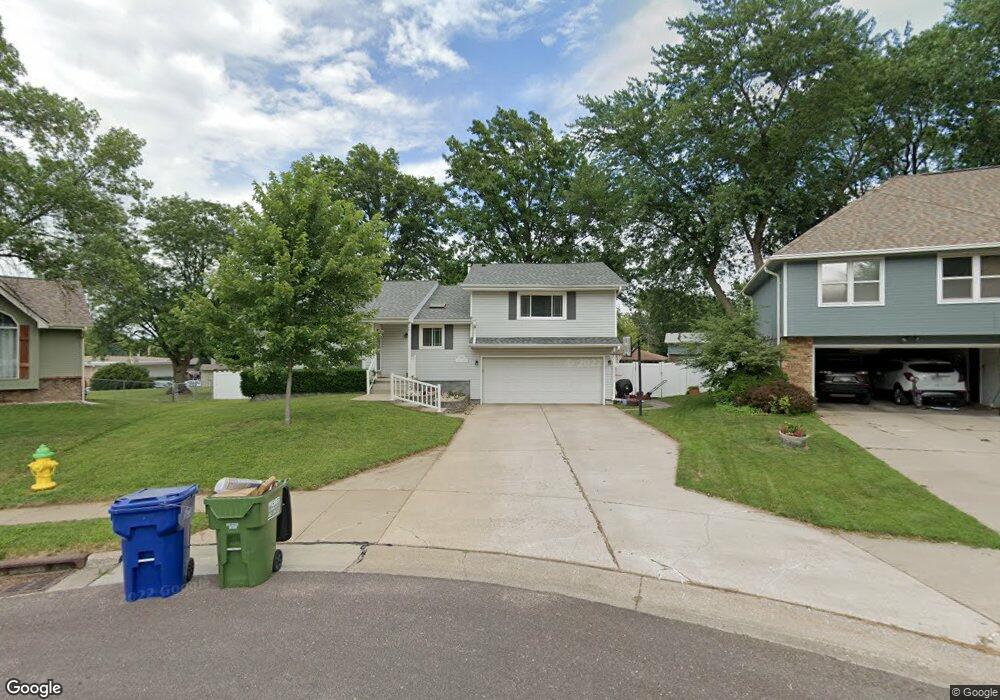
703 S Taylor Cir Papillion, NE 68046
Estimated Value: $340,518 - $361,000
3
Beds
2
Baths
1,637
Sq Ft
$213/Sq Ft
Est. Value
About This Home
This home is located at 703 S Taylor Cir, Papillion, NE 68046 and is currently estimated at $349,130, approximately $213 per square foot. 703 S Taylor Cir is a home located in Sarpy County with nearby schools including Trumble Park Elementary School, Papillion Middle School, and Papillion La Vista South High School.
Ownership History
Date
Name
Owned For
Owner Type
Purchase Details
Closed on
Jul 13, 2015
Sold by
Lachner Judith A and Lachner Gerald L
Bought by
Vanslyke Bryan and Forster Mikayla K
Current Estimated Value
Home Financials for this Owner
Home Financials are based on the most recent Mortgage that was taken out on this home.
Original Mortgage
$184,300
Outstanding Balance
$144,802
Interest Rate
4.08%
Estimated Equity
$204,328
Purchase Details
Closed on
Nov 18, 2013
Sold by
Kimmey Edward and Kimmey Sheri
Bought by
Lachner Judith A and Lachner Gerald L
Purchase Details
Closed on
Mar 25, 2004
Sold by
Kimmey Edward D and Kimmey Sheri L
Bought by
Kimmey Edward D and Kimmey Sheri L
Home Financials for this Owner
Home Financials are based on the most recent Mortgage that was taken out on this home.
Original Mortgage
$142,007
Interest Rate
5.38%
Purchase Details
Closed on
May 25, 2002
Sold by
Perryman Gary S and Perryman Jean A
Bought by
Kimmey Edward D and Christensen Sheri L
Home Financials for this Owner
Home Financials are based on the most recent Mortgage that was taken out on this home.
Original Mortgage
$138,650
Interest Rate
6.77%
Create a Home Valuation Report for This Property
The Home Valuation Report is an in-depth analysis detailing your home's value as well as a comparison with similar homes in the area
Home Values in the Area
Average Home Value in this Area
Purchase History
| Date | Buyer | Sale Price | Title Company |
|---|---|---|---|
| Vanslyke Bryan | $194,000 | Midwest Title Inc | |
| Lachner Judith A | $190,000 | Btc | |
| Kimmey Edward D | -- | -- | |
| Kimmey Edward D | $140,000 | -- |
Source: Public Records
Mortgage History
| Date | Status | Borrower | Loan Amount |
|---|---|---|---|
| Open | Vanslyke Bryan | $184,300 | |
| Previous Owner | Kimmey Edward D | $142,007 | |
| Previous Owner | Kimmey Edward D | $138,650 |
Source: Public Records
Tax History Compared to Growth
Tax History
| Year | Tax Paid | Tax Assessment Tax Assessment Total Assessment is a certain percentage of the fair market value that is determined by local assessors to be the total taxable value of land and additions on the property. | Land | Improvement |
|---|---|---|---|---|
| 2025 | $4,288 | $315,163 | $51,000 | $264,163 |
| 2024 | $5,157 | $289,120 | $46,000 | $243,120 |
| 2023 | $5,157 | $273,901 | $42,000 | $231,901 |
| 2022 | $4,991 | $244,587 | $40,000 | $204,587 |
| 2021 | $4,576 | $219,819 | $37,000 | $182,819 |
| 2020 | $4,505 | $214,248 | $37,000 | $177,248 |
| 2019 | $4,374 | $208,143 | $34,000 | $174,143 |
| 2018 | $4,080 | $191,206 | $29,000 | $162,206 |
| 2017 | $3,927 | $184,099 | $27,000 | $157,099 |
| 2016 | $3,901 | $183,129 | $27,000 | $156,129 |
| 2015 | $3,799 | $178,863 | $27,000 | $151,863 |
| 2014 | $3,541 | $165,605 | $27,000 | $138,605 |
| 2012 | -- | $164,900 | $27,000 | $137,900 |
Source: Public Records
Map
Nearby Homes
- 809 Buckboard Blvd
- 309 S Fillmore St
- 906 Chisholm Trail
- 308 Crest Rd
- LOT 293 Granite Lake
- Lot 289 Granite Lake
- Lot 71 N Shore Commercial
- Lot 39
- 12378 Lake Vista Dr
- 262 Ashbury Hills St
- 259 Ashbury Hils St
- 235 Lot St
- Lot 28 Ashbury Hills
- 704 Valley Rd
- 907 Woodland Ave
- Lot 52 Unit Lot 52
- 613 Valley Rd
- Lot 130 Shadow Lake 2
- TBD Slayton St
- 1120 Delmar St Unit 4B
- 703 S Taylor Cr
- 701 S Taylor Cir
- 705 S Taylor Cir
- 702 S Polk St
- 507 S Taylor Cir
- 700 S Polk St
- 704 S Polk St
- 707 S Taylor Cir
- 700 S Taylor Cir
- 706 S Polk St
- 702 S Taylor Cir
- 704 S Taylor Cir
- 709 S Taylor Cir
- 708 S Polk St
- 706 S Taylor Cir
- 703 S Polk St
- 707 S Polk St
- 711 S Polk St
- 708 S Taylor Cir
- 635 S Polk St