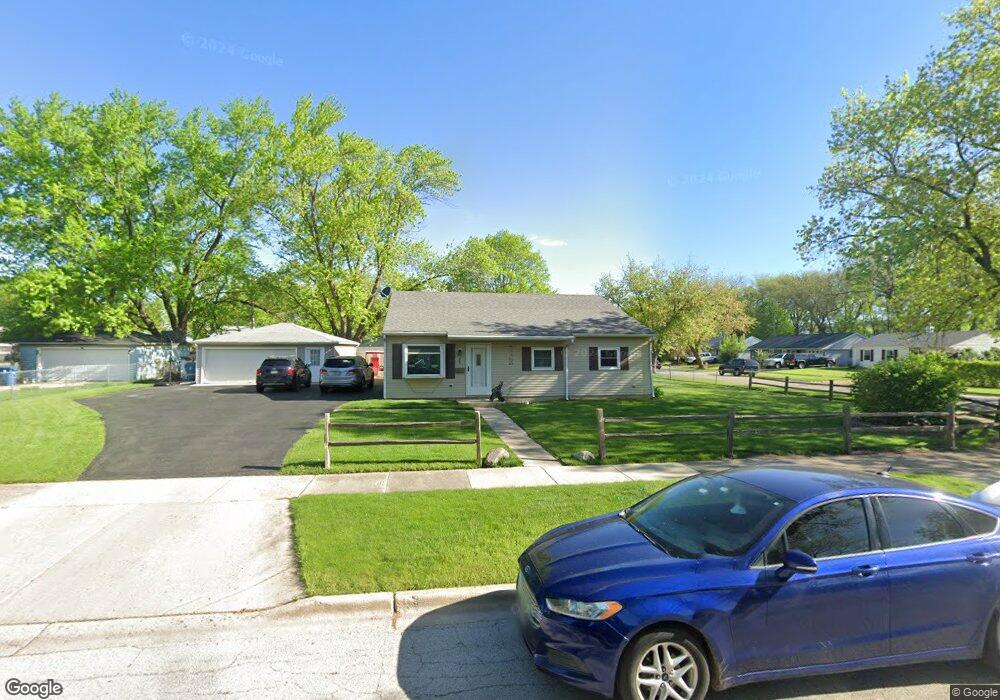
703 Springbrook Dr Aurora, IL 60506
North River NeighborhoodEstimated Value: $242,000 - $271,000
3
Beds
1
Bath
925
Sq Ft
$277/Sq Ft
Est. Value
About This Home
This home is located at 703 Springbrook Dr, Aurora, IL 60506 and is currently estimated at $256,279, approximately $277 per square foot. 703 Springbrook Dr is a home located in Kane County with nearby schools including Fearn Elementary School, Jewel Middle School, and West Aurora High School.
Ownership History
Date
Name
Owned For
Owner Type
Purchase Details
Closed on
Jan 6, 2017
Sold by
Treadway Dorthy M and Lendman Babette M
Bought by
Meara Rebbecca Mahan O
Current Estimated Value
Purchase Details
Closed on
Oct 3, 2011
Sold by
Miller Karen E
Bought by
Treadway Dorothy M and Treadway Babette M
Purchase Details
Closed on
Mar 29, 1996
Sold by
Domme Peggy
Bought by
Miller Karen E
Home Financials for this Owner
Home Financials are based on the most recent Mortgage that was taken out on this home.
Original Mortgage
$98,000
Interest Rate
10.1%
Purchase Details
Closed on
Mar 22, 1996
Sold by
Donnelly James
Bought by
Miller Karen E
Home Financials for this Owner
Home Financials are based on the most recent Mortgage that was taken out on this home.
Original Mortgage
$98,000
Interest Rate
10.1%
Purchase Details
Closed on
Mar 21, 1996
Sold by
Miller James W
Bought by
Miller Karen E
Home Financials for this Owner
Home Financials are based on the most recent Mortgage that was taken out on this home.
Original Mortgage
$98,000
Interest Rate
10.1%
Create a Home Valuation Report for This Property
The Home Valuation Report is an in-depth analysis detailing your home's value as well as a comparison with similar homes in the area
Home Values in the Area
Average Home Value in this Area
Purchase History
| Date | Buyer | Sale Price | Title Company |
|---|---|---|---|
| Meara Rebbecca Mahan O | -- | Attorney | |
| Treadway Dorothy M | -- | None Available | |
| Miller Karen E | $85,000 | Chicago Title Insurance Co | |
| Miller Karen E | -- | Ticor Title Insurance | |
| Miller Karen E | -- | Chicago Title Insurance Co |
Source: Public Records
Mortgage History
| Date | Status | Borrower | Loan Amount |
|---|---|---|---|
| Previous Owner | Miller Karen E | $98,000 |
Source: Public Records
Tax History
| Year | Tax Paid | Tax Assessment Tax Assessment Total Assessment is a certain percentage of the fair market value that is determined by local assessors to be the total taxable value of land and additions on the property. | Land | Improvement |
|---|---|---|---|---|
| 2024 | $6,244 | $86,864 | $13,260 | $73,604 |
| 2023 | $5,963 | $77,613 | $11,848 | $65,765 |
| 2022 | $5,737 | $70,815 | $10,810 | $60,005 |
| 2021 | $5,475 | $65,929 | $10,064 | $55,865 |
| 2020 | $6,075 | $70,895 | $9,348 | $61,547 |
| 2019 | $5,836 | $65,686 | $8,661 | $57,025 |
| 2018 | $3,674 | $58,897 | $8,011 | $50,886 |
| 2017 | $3,401 | $53,875 | $7,381 | $46,494 |
| 2016 | $3,174 | $48,583 | $6,327 | $42,256 |
| 2015 | -- | $42,429 | $5,441 | $36,988 |
| 2014 | -- | $29,431 | $5,233 | $24,198 |
| 2013 | -- | $30,716 | $5,158 | $25,558 |
Source: Public Records
Map
Nearby Homes
- 461 Sullivan Rd
- 504 Princeton Dr
- 388 Manor Place
- 1229 Yellowpine Dr
- 43 S Juniper Dr Unit 3
- 500 California Ave
- 307 Hill Ave
- 847 Foran Ln
- 310 Oak St
- 178 Mistwood Ln
- 911 Darwin St
- 833 Sheldon Ave
- 781 N Elmwood Dr
- 341 Woodlyn Dr Unit 3
- 1104 New Haven Ave
- 1815 Brighton Cir
- 1351 Monomoy St Unit D
- 14-18 N Lake St
- 833 N Randall Rd Unit C4
- 440 Woodlyn Dr
- 1558 Cambridge Ave
- 711 Springbrook Dr Unit 4
- 715 Springbrook Dr
- 704 Calico Dr
- 710 Calico Dr
- 700 Springbrook Dr
- 706 Springbrook Dr
- 609 Springbrook Dr
- 618 Springbrook Dr Unit 4
- 1557 Cambridge Ave
- 716 Calico Dr
- 712 Springbrook Dr
- 721 Springbrook Dr
- 612 Springbrook Dr
- 720 Calico Dr
- 1537 Hollycrest Ave
- 1567 Cambridge Ave Unit 4
- 608 Springbrook Dr
- 725 Springbrook Dr
- 726 Calico Dr