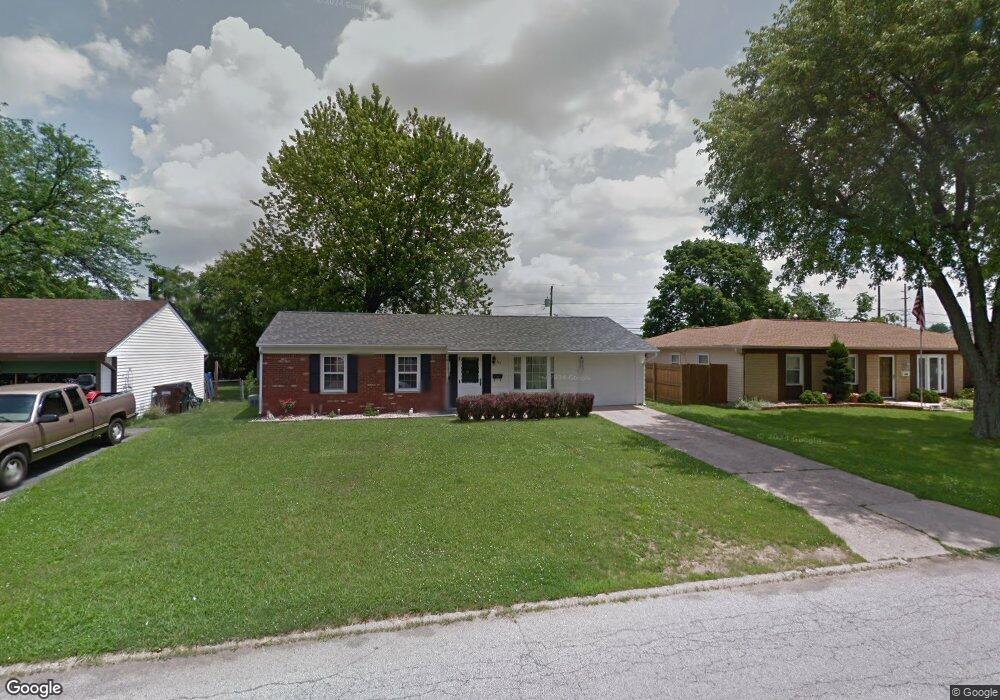
703 Sweetbriar Ave Whiteland, IN 46184
Estimated Value: $167,000 - $209,000
3
Beds
1
Bath
975
Sq Ft
$198/Sq Ft
Est. Value
About This Home
This home is located at 703 Sweetbriar Ave, Whiteland, IN 46184 and is currently estimated at $192,923, approximately $197 per square foot. 703 Sweetbriar Ave is a home located in Johnson County with nearby schools including Break-O-Day Elementary School, Clark-Pleasant Middle School, and Whiteland Community High School.
Ownership History
Date
Name
Owned For
Owner Type
Purchase Details
Closed on
Nov 10, 2011
Sold by
Martin Philip and Mcclellan Wendy
Bought by
Shanafelt Penny Sue
Current Estimated Value
Home Financials for this Owner
Home Financials are based on the most recent Mortgage that was taken out on this home.
Original Mortgage
$70,174
Outstanding Balance
$46,634
Interest Rate
3.5%
Mortgage Type
FHA
Estimated Equity
$146,289
Purchase Details
Closed on
Jan 11, 2011
Sold by
Federal Home Loan Mortgage Corporation
Bought by
Martin Phillip and Mcclellan Wendy
Purchase Details
Closed on
Sep 16, 2010
Sold by
Duboise Chelsea
Bought by
Federal Home Loan Mortgage Corporation
Purchase Details
Closed on
Nov 29, 2006
Sold by
Pendygraft John D and Pendygraft Devanni M
Bought by
Duboise Chelsea
Home Financials for this Owner
Home Financials are based on the most recent Mortgage that was taken out on this home.
Original Mortgage
$82,000
Interest Rate
6.33%
Mortgage Type
New Conventional
Create a Home Valuation Report for This Property
The Home Valuation Report is an in-depth analysis detailing your home's value as well as a comparison with similar homes in the area
Home Values in the Area
Average Home Value in this Area
Purchase History
| Date | Buyer | Sale Price | Title Company |
|---|---|---|---|
| Shanafelt Penny Sue | -- | First American Title Insuran | |
| Martin Phillip | -- | None Available | |
| Federal Home Loan Mortgage Corporation | $63,000 | None Available | |
| Duboise Chelsea | -- | None Available |
Source: Public Records
Mortgage History
| Date | Status | Borrower | Loan Amount |
|---|---|---|---|
| Open | Shanafelt Penny Sue | $70,174 | |
| Previous Owner | Duboise Chelsea | $82,000 |
Source: Public Records
Tax History Compared to Growth
Tax History
| Year | Tax Paid | Tax Assessment Tax Assessment Total Assessment is a certain percentage of the fair market value that is determined by local assessors to be the total taxable value of land and additions on the property. | Land | Improvement |
|---|---|---|---|---|
| 2025 | $1,253 | $149,500 | $42,000 | $107,500 |
| 2024 | $1,253 | $142,000 | $42,000 | $100,000 |
| 2023 | $1,286 | $139,700 | $42,000 | $97,700 |
| 2022 | $1,262 | $128,700 | $35,000 | $93,700 |
| 2021 | $1,106 | $114,600 | $35,000 | $79,600 |
| 2020 | $629 | $84,100 | $23,500 | $60,600 |
| 2019 | $524 | $77,900 | $17,800 | $60,100 |
| 2018 | $595 | $81,300 | $15,100 | $66,200 |
| 2017 | $587 | $80,400 | $15,100 | $65,300 |
| 2016 | $477 | $73,100 | $15,100 | $58,000 |
| 2014 | $489 | $66,200 | $14,800 | $51,400 |
| 2013 | $489 | $71,500 | $14,800 | $56,700 |
Source: Public Records
Map
Nearby Homes
- 624 Sweetbriar Ave
- 269 Switchgrass Ln
- 287 Bluestem Ln
- 144 Bluestem Ln
- 111 Meadow Creek Blvd
- 840 Sweetbriar Ave
- 257 Creekway Ct
- 50 Meadow Creek Blvd
- 539 Delbrook Dr
- 0 E 700 N Unit MBR22036500
- 250 Southlane Dr
- 249 Lori Ann Dr
- 239 Shelton Place
- 42 Grassyway Ct
- 230 Parkview Dr
- 229 Arlington St
- 821 Princeton Dr
- 241 Mooreland Dr
- 409 Parkway St
- 143 Tracy Ridge Blvd
- 709 Sweetbriar Ave
- 649 Sweetbriar Ave
- 715 Sweetbriar Ave
- 641 Sweetbriar Ave
- 702 Sweetbriar Ave
- 710 Sweetbriar Ave
- 644 Sweetbriar Ave
- 723 Sweetbriar Ave
- 635 Sweetbriar Ave
- Lot C Us 31
- Lot B Us 31
- Lot A Us 31
- Lot D Us 31
- Lot E Us 31
- 638 Sweetbriar Ave
- 629 Sweetbriar Ave
- 451 Pleasant Dr
- 722 Sweetbriar Ave
- 630 Sweetbriar Ave
- 452 Granada Place