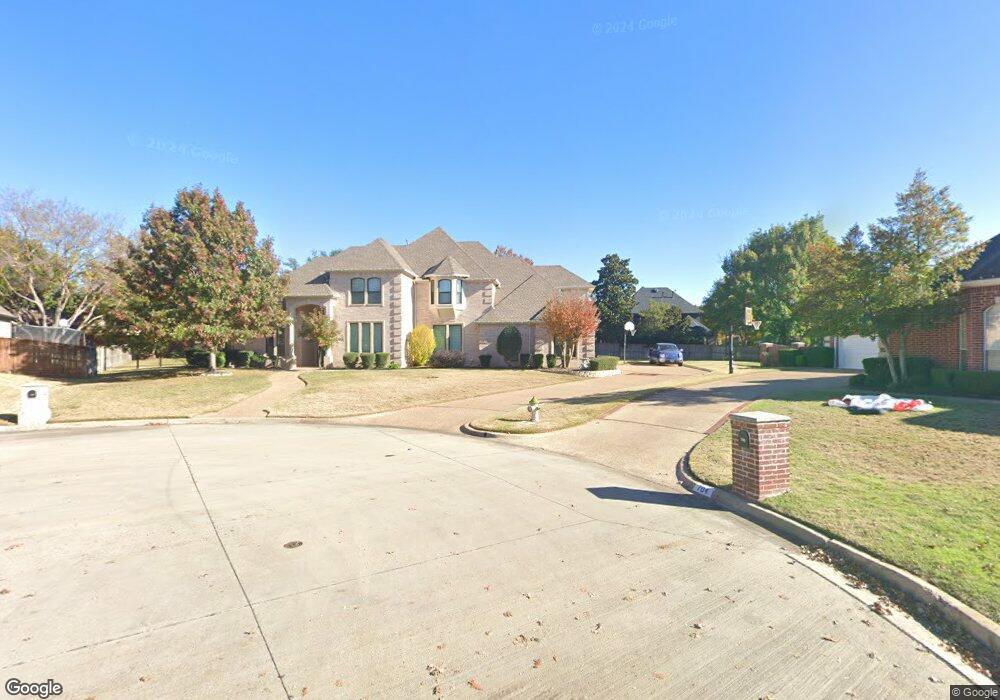
703 Verdun Ct Southlake, TX 76092
Estimated Value: $1,171,000 - $1,403,000
5
Beds
5
Baths
4,192
Sq Ft
$307/Sq Ft
Est. Value
About This Home
This home is located at 703 Verdun Ct, Southlake, TX 76092 and is currently estimated at $1,285,592, approximately $306 per square foot. 703 Verdun Ct is a home located in Tarrant County with nearby schools including Old Union Elementary School, Eubanks Intermediate School, and George Dawson Middle School.
Ownership History
Date
Name
Owned For
Owner Type
Purchase Details
Closed on
Dec 7, 2018
Sold by
Noetzel Kelly
Bought by
Noetzel Steve J
Current Estimated Value
Purchase Details
Closed on
Feb 26, 1998
Sold by
Calais Construction Inc
Bought by
Noetzel Steven J and Noetzel Kelly
Home Financials for this Owner
Home Financials are based on the most recent Mortgage that was taken out on this home.
Original Mortgage
$152,000
Outstanding Balance
$27,537
Interest Rate
6.91%
Estimated Equity
$1,258,055
Purchase Details
Closed on
Nov 5, 1997
Sold by
Versailles Ltd
Bought by
Calais Construction Inc
Home Financials for this Owner
Home Financials are based on the most recent Mortgage that was taken out on this home.
Original Mortgage
$297,600
Interest Rate
7.27%
Create a Home Valuation Report for This Property
The Home Valuation Report is an in-depth analysis detailing your home's value as well as a comparison with similar homes in the area
Home Values in the Area
Average Home Value in this Area
Purchase History
| Date | Buyer | Sale Price | Title Company |
|---|---|---|---|
| Noetzel Steve J | -- | None Available | |
| Noetzel Steven J | -- | Commonwealth Land Title | |
| Calais Construction Inc | -- | Commonwealth Land Title |
Source: Public Records
Mortgage History
| Date | Status | Borrower | Loan Amount |
|---|---|---|---|
| Open | Noetzel Steven J | $152,000 | |
| Previous Owner | Calais Construction Inc | $297,600 |
Source: Public Records
Tax History Compared to Growth
Tax History
| Year | Tax Paid | Tax Assessment Tax Assessment Total Assessment is a certain percentage of the fair market value that is determined by local assessors to be the total taxable value of land and additions on the property. | Land | Improvement |
|---|---|---|---|---|
| 2025 | $15,167 | $1,000,000 | $383,040 | $616,960 |
| 2024 | $15,167 | $1,000,000 | $383,040 | $616,960 |
| 2023 | $16,739 | $1,455,468 | $383,040 | $1,072,428 |
| 2022 | $18,012 | $1,057,279 | $256,700 | $800,579 |
| 2021 | $17,305 | $855,051 | $256,700 | $598,351 |
| 2020 | $15,860 | $690,000 | $237,060 | $452,940 |
| 2019 | $16,708 | $690,000 | $150,000 | $540,000 |
| 2018 | $16,488 | $680,906 | $150,000 | $530,906 |
| 2017 | $16,637 | $671,235 | $150,000 | $521,235 |
| 2016 | $16,597 | $669,617 | $150,000 | $519,617 |
| 2015 | $14,685 | $653,275 | $90,000 | $563,275 |
| 2014 | $14,685 | $586,600 | $90,000 | $496,600 |
Source: Public Records
Map
Nearby Homes
- 1401 Chardonnay Ct
- 1012 Cool River Dr
- 1100 La Paloma Ct
- 702 Sussex Ct
- 1304 Kings Brook Ct
- 223 Westwood Dr
- 710 Longford Dr
- 708 Nettleton Dr
- 1206 Timberline Ct
- 712 Ashleigh Ln
- 1032 Rosavine Dr
- 1028 Rosavine Dr
- 1017 Rosavine Dr
- 1004 Rosavine Dr
- 1020 Rosavine Dr
- 1012 Rosavine Dr
- 1024 Rosavine Dr
- 1005 Rosavine Dr
- 1016 Rosavine Dr
- 1008 Rosavine Dr
- 701 Verdun Ct
- 618 Bordeaux Dr
- 616 Bordeaux Dr
- 704 Verdun Ct
- 1107 Calais Dr
- 614 Bordeaux Dr
- 707 Lorraine Dr
- 702 Verdun Ct
- 709 Lorraine Dr
- 705 Lorraine Dr
- 700 Verdun Ct
- 1109 Calais Dr
- 1106 Calais Dr
- 612 Bordeaux Dr
- 617 Bordeaux Dr
- 701 Lorraine Dr
- 1200 Lorraine Ct
- 1108 Calais Dr
- 1104 Calais Dr
- 613 Lorraine Dr