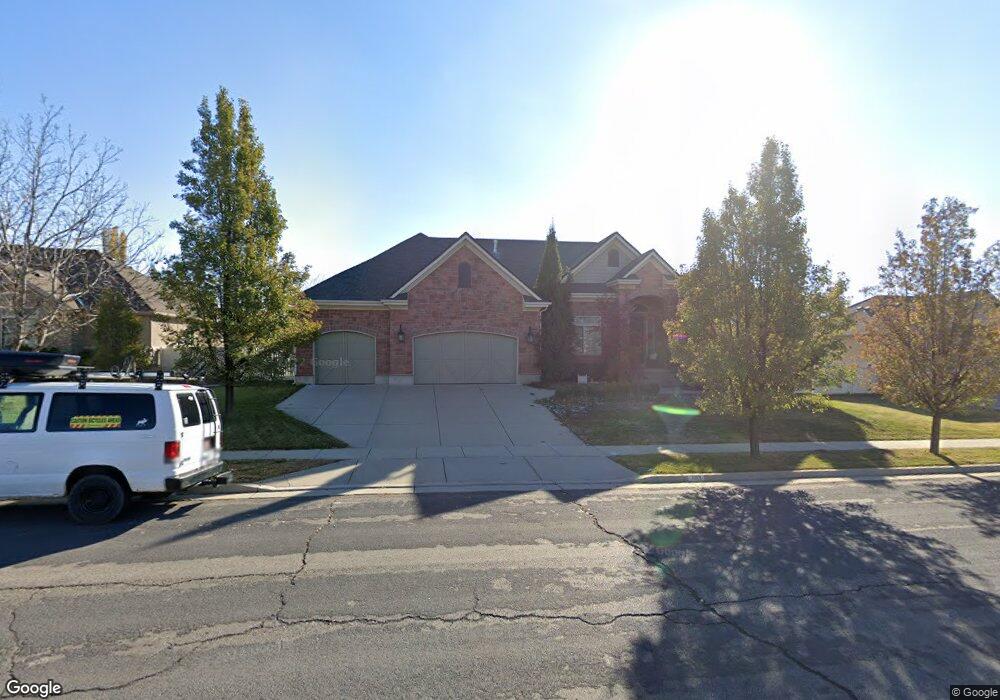
703 W 2150 S Syracuse, UT 84075
Estimated Value: $728,000 - $845,814
1
Bed
3
Baths
2,843
Sq Ft
$279/Sq Ft
Est. Value
About This Home
This home is located at 703 W 2150 S, Syracuse, UT 84075 and is currently estimated at $792,704, approximately $278 per square foot. 703 W 2150 S is a home located in Davis County with nearby schools including Bluff Ridge Elementary, Legacy Junior High School, and Clearfield High School.
Ownership History
Date
Name
Owned For
Owner Type
Purchase Details
Closed on
Jun 5, 2024
Sold by
Bennett Rebecca W
Bought by
Rebecca Winters Bennett Family Trust and Bennett
Current Estimated Value
Purchase Details
Closed on
Jun 27, 2007
Sold by
Gmw Development Inc
Bought by
Bennett Peter H and Bennett Rebecca W
Purchase Details
Closed on
Aug 8, 2005
Sold by
Waynell Investment Co Llc
Bought by
Gmw Development Inc and Ivory North
Create a Home Valuation Report for This Property
The Home Valuation Report is an in-depth analysis detailing your home's value as well as a comparison with similar homes in the area
Home Values in the Area
Average Home Value in this Area
Purchase History
| Date | Buyer | Sale Price | Title Company |
|---|---|---|---|
| Rebecca Winters Bennett Family Trust | -- | None Listed On Document | |
| Bennett Peter H | -- | Cottonwood Title Ins Agency | |
| Gmw Development Inc | -- | Bonneville Title Company |
Source: Public Records
Tax History Compared to Growth
Tax History
| Year | Tax Paid | Tax Assessment Tax Assessment Total Assessment is a certain percentage of the fair market value that is determined by local assessors to be the total taxable value of land and additions on the property. | Land | Improvement |
|---|---|---|---|---|
| 2025 | $4,298 | $414,700 | $127,953 | $286,747 |
| 2024 | $4,049 | $393,250 | $108,737 | $284,513 |
| 2023 | $3,797 | $672,000 | $151,343 | $520,657 |
| 2022 | $4,070 | $394,900 | $86,715 | $308,185 |
| 2021 | $3,802 | $571,000 | $128,479 | $442,521 |
| 2020 | $3,500 | $509,000 | $110,452 | $398,548 |
| 2019 | $3,274 | $470,000 | $109,759 | $360,241 |
| 2018 | $3,207 | $457,000 | $105,034 | $351,966 |
| 2016 | $3,069 | $229,350 | $40,248 | $189,102 |
| 2015 | $3,175 | $225,940 | $40,248 | $185,692 |
| 2014 | $2,824 | $204,816 | $40,248 | $164,568 |
| 2013 | -- | $207,738 | $38,213 | $169,525 |
Source: Public Records
Map
Nearby Homes