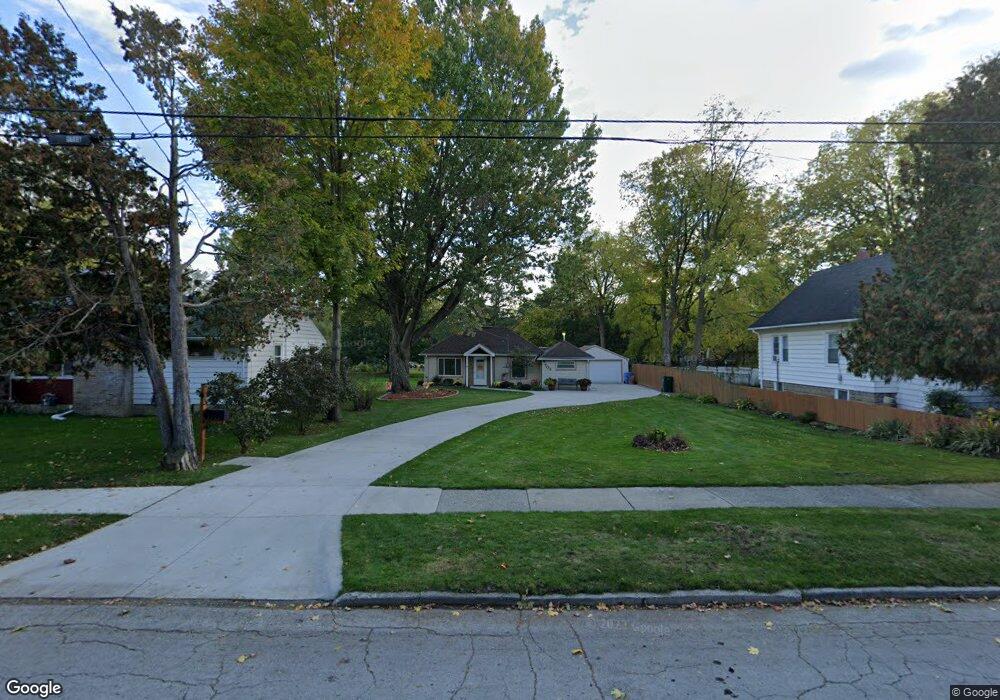
703 W Berry Ave Lansing, MI 48910
Old Everett NeighborhoodEstimated Value: $110,440 - $152,000
--
Bed
1
Bath
847
Sq Ft
$149/Sq Ft
Est. Value
About This Home
This home is located at 703 W Berry Ave, Lansing, MI 48910 and is currently estimated at $126,110, approximately $148 per square foot. 703 W Berry Ave is a home located in Ingham County with nearby schools including Kendon School, Attwood School, and Everett High School.
Ownership History
Date
Name
Owned For
Owner Type
Purchase Details
Closed on
Sep 25, 2025
Sold by
Carter Judy and Erway Judy
Bought by
Carter John and Carter Judy
Current Estimated Value
Purchase Details
Closed on
Aug 7, 2003
Sold by
Linck Mary K
Bought by
Erway Judy
Home Financials for this Owner
Home Financials are based on the most recent Mortgage that was taken out on this home.
Original Mortgage
$76,277
Interest Rate
6.33%
Mortgage Type
FHA
Purchase Details
Closed on
Apr 8, 2002
Sold by
Ballans Glenn A
Bought by
Linck Mary K
Home Financials for this Owner
Home Financials are based on the most recent Mortgage that was taken out on this home.
Original Mortgage
$68,400
Interest Rate
10.22%
Mortgage Type
Purchase Money Mortgage
Purchase Details
Closed on
Nov 23, 2001
Sold by
Yates Randal L
Bought by
Ballans Glenn A
Purchase Details
Closed on
Apr 10, 1998
Sold by
Parker Brian S and Parker Kelly D
Bought by
Yates Randal L
Purchase Details
Closed on
Aug 1, 1995
Create a Home Valuation Report for This Property
The Home Valuation Report is an in-depth analysis detailing your home's value as well as a comparison with similar homes in the area
Home Values in the Area
Average Home Value in this Area
Purchase History
| Date | Buyer | Sale Price | Title Company |
|---|---|---|---|
| Carter John | -- | None Listed On Document | |
| Erway Judy | $77,500 | Trans | |
| Linck Mary K | $72,000 | -- | |
| Ballans Glenn A | $54,000 | -- | |
| Yates Randal L | $54,000 | -- | |
| -- | $48,000 | -- |
Source: Public Records
Mortgage History
| Date | Status | Borrower | Loan Amount |
|---|---|---|---|
| Previous Owner | Erway Judy | $76,277 | |
| Previous Owner | Linck Mary K | $68,400 |
Source: Public Records
Tax History Compared to Growth
Tax History
| Year | Tax Paid | Tax Assessment Tax Assessment Total Assessment is a certain percentage of the fair market value that is determined by local assessors to be the total taxable value of land and additions on the property. | Land | Improvement |
|---|---|---|---|---|
| 2025 | $1,772 | $49,800 | $11,500 | $38,300 |
| 2024 | $14 | $40,600 | $11,500 | $29,100 |
| 2023 | $1,664 | $36,500 | $11,500 | $25,000 |
| 2022 | $1,504 | $32,500 | $11,500 | $21,000 |
| 2021 | $1,473 | $28,900 | $5,700 | $23,200 |
| 2020 | $1,463 | $26,400 | $5,700 | $20,700 |
| 2019 | $1,400 | $25,600 | $5,700 | $19,900 |
| 2018 | $1,315 | $22,700 | $5,700 | $17,000 |
| 2017 | $1,258 | $22,700 | $5,700 | $17,000 |
| 2016 | $1,204 | $22,300 | $5,700 | $16,600 |
| 2015 | $1,204 | $21,700 | $11,463 | $10,237 |
| 2014 | $1,204 | $20,600 | $6,878 | $13,722 |
Source: Public Records
Map
Nearby Homes
- 715 W Holmes Rd
- 3322 Palmer St
- 3430 Palmer St
- 416 W Holmes Rd
- 3705 Burchfield Dr
- 3801 Schlee St
- 0 Burchfield Dr
- 3820 Lowcroft Ave
- 924 Loa St
- 4004 Lowcroft Ave
- 2901 Palmer St
- 410 Dunlap St
- 334 Dunlap St
- 2806 S Washington Ave
- 0 Eaton Ct
- 0 Rickle
- 4114 Burchfield Dr
- 1301 Warwick Dr
- 4125 Lowcroft Ave
- 1113 Eaton Ct
- 709 W Berry Ave
- 639 W Berry Ave
- 713 W Berry Ave
- 635 W Berry Ave
- 723 W Berry Ave
- 0 Lowcroft Ave
- 625 W Berry Ave
- 638 W Holmes Rd
- 706 W Berry Ave
- 710 W Berry Ave
- 634 W Holmes Rd
- 634 W Berry Ave
- 630 W Holmes Rd
- 621 W Berry Ave
- 3249 S Washington Ave
- 628 W Holmes Rd
- 3317 S Washington Ave
- 708 W Holmes Rd
- 724 W Holmes Rd
- 3311 S Washington Ave