Estimated Value: $85,000 - $136,000
2
Beds
1
Bath
744
Sq Ft
$137/Sq Ft
Est. Value
About This Home
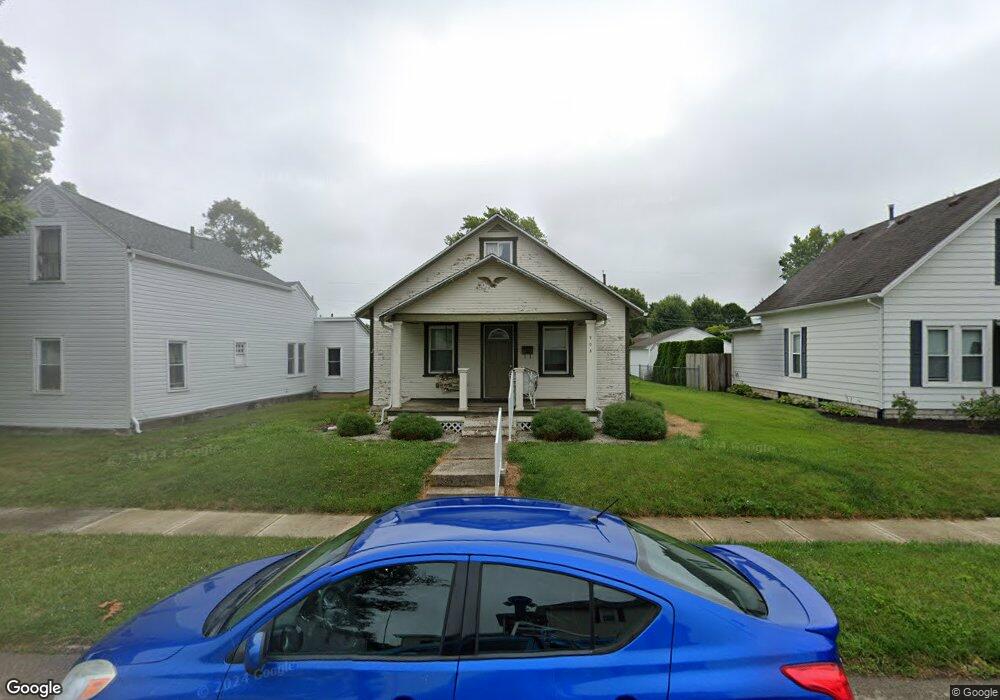
This home is located at 703 Willard St, Piqua, OH 45356 and is currently estimated at $102,290, approximately $137 per square foot. 703 Willard St is a home located in Miami County with nearby schools including Piqua Junior High School, Piqua High School, and Nicholas School.
Ownership History
Date
Name
Owned For
Owner Type
Purchase Details
Closed on
Jun 11, 2021
Sold by
Adams Brandon J and Adams Brandon
Bought by
Bja Renatl Properties Llc
Current Estimated Value
Purchase Details
Closed on
Mar 2, 2016
Sold by
Unity National Bank
Bought by
Adams Brandon J
Purchase Details
Closed on
Jun 1, 1994
Sold by
Young Rosalie
Bought by
Landis Susan J
Create a Home Valuation Report for This Property
The Home Valuation Report is an in-depth analysis detailing your home's value as well as a comparison with similar homes in the area
Home Values in the Area
Average Home Value in this Area
Purchase History
| Date | Buyer | Sale Price | Title Company |
|---|---|---|---|
| Bja Renatl Properties Llc | -- | None Available | |
| Adams Brandon J | $28,500 | Attorney | |
| Landis Susan J | $59,900 | -- |
Source: Public Records
Mortgage History
| Date | Status | Borrower | Loan Amount |
|---|---|---|---|
| Closed | Landis Susan J | -- |
Source: Public Records
Tax History
| Year | Tax Paid | Tax Assessment Tax Assessment Total Assessment is a certain percentage of the fair market value that is determined by local assessors to be the total taxable value of land and additions on the property. | Land | Improvement |
|---|---|---|---|---|
| 2024 | $1,038 | $17,750 | $6,580 | $11,170 |
| 2023 | $748 | $17,750 | $6,580 | $11,170 |
| 2022 | $761 | $17,750 | $6,580 | $11,170 |
| 2021 | $600 | $13,130 | $4,870 | $8,260 |
| 2020 | $588 | $13,130 | $4,870 | $8,260 |
| 2019 | $591 | $13,130 | $4,870 | $8,260 |
| 2018 | $633 | $13,410 | $4,870 | $8,540 |
| 2017 | $640 | $13,410 | $4,870 | $8,540 |
| 2016 | $633 | $13,410 | $4,870 | $8,540 |
| 2015 | $624 | $12,920 | $4,690 | $8,230 |
| 2014 | $624 | $12,920 | $4,690 | $8,230 |
| 2013 | $627 | $12,920 | $4,690 | $8,230 |
Source: Public Records
Map
Nearby Homes
Your Personal Tour Guide
Ask me questions while you tour the home.