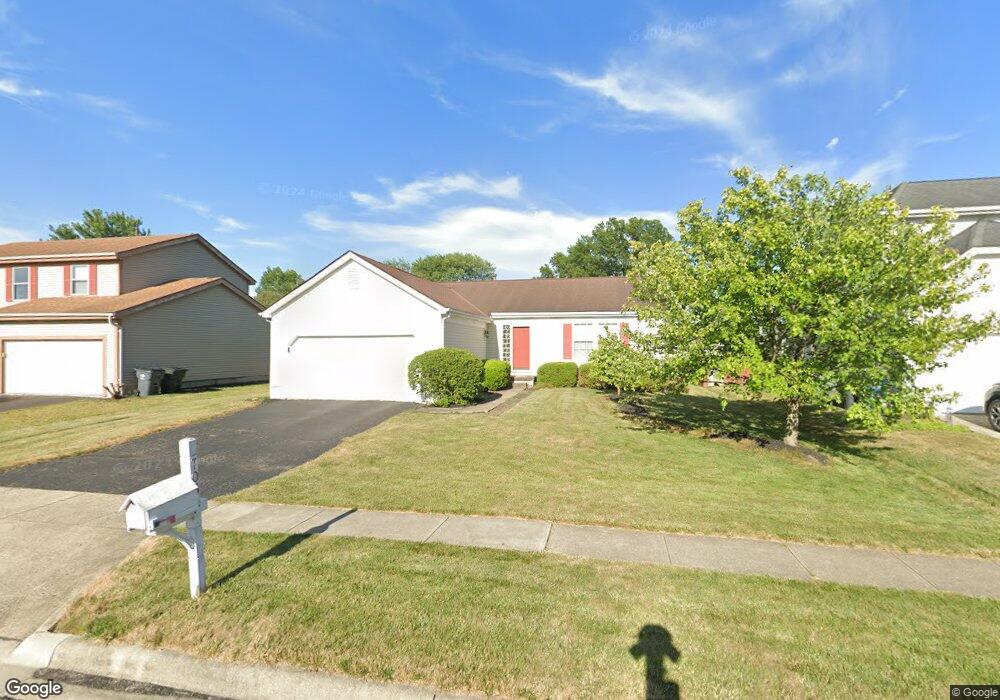
703 Woodmark Run Columbus, OH 43230
Woodside Green NeighborhoodEstimated Value: $326,000 - $385,000
3
Beds
2
Baths
1,408
Sq Ft
$256/Sq Ft
Est. Value
About This Home
This home is located at 703 Woodmark Run, Columbus, OH 43230 and is currently estimated at $360,632, approximately $256 per square foot. 703 Woodmark Run is a home located in Franklin County with nearby schools including Royal Manor Elementary School, Gahanna West Middle School, and Lincoln High School.
Ownership History
Date
Name
Owned For
Owner Type
Purchase Details
Closed on
May 1, 2008
Sold by
Royko Michael D and Royko Stephanie J
Bought by
Coryea Christopher S
Current Estimated Value
Home Financials for this Owner
Home Financials are based on the most recent Mortgage that was taken out on this home.
Original Mortgage
$137,600
Outstanding Balance
$87,369
Interest Rate
5.93%
Mortgage Type
New Conventional
Estimated Equity
$273,263
Purchase Details
Closed on
Apr 14, 2006
Sold by
Fithen Donald L and Fithen Tracey F
Bought by
Royko Michael D and Maruschak Stephanie J
Home Financials for this Owner
Home Financials are based on the most recent Mortgage that was taken out on this home.
Original Mortgage
$157,000
Interest Rate
6.48%
Mortgage Type
Fannie Mae Freddie Mac
Purchase Details
Closed on
Sep 27, 1993
Bought by
Fithen Donald L
Purchase Details
Closed on
May 25, 1993
Create a Home Valuation Report for This Property
The Home Valuation Report is an in-depth analysis detailing your home's value as well as a comparison with similar homes in the area
Home Values in the Area
Average Home Value in this Area
Purchase History
| Date | Buyer | Sale Price | Title Company |
|---|---|---|---|
| Coryea Christopher S | $172,000 | Title First | |
| Royko Michael D | $157,000 | Fati | |
| Fithen Donald L | $117,500 | -- | |
| -- | $57,000 | -- |
Source: Public Records
Mortgage History
| Date | Status | Borrower | Loan Amount |
|---|---|---|---|
| Open | Coryea Christopher S | $137,600 | |
| Previous Owner | Royko Michael D | $157,000 |
Source: Public Records
Tax History Compared to Growth
Tax History
| Year | Tax Paid | Tax Assessment Tax Assessment Total Assessment is a certain percentage of the fair market value that is determined by local assessors to be the total taxable value of land and additions on the property. | Land | Improvement |
|---|---|---|---|---|
| 2024 | $5,790 | $98,290 | $27,620 | $70,670 |
| 2023 | $5,718 | $98,280 | $27,615 | $70,665 |
| 2022 | $4,823 | $64,580 | $13,270 | $51,310 |
| 2021 | $4,664 | $64,580 | $13,270 | $51,310 |
| 2020 | $4,608 | $64,340 | $13,270 | $51,070 |
| 2019 | $3,838 | $53,480 | $11,060 | $42,420 |
| 2018 | $3,860 | $53,480 | $11,060 | $42,420 |
| 2017 | $3,715 | $53,480 | $11,060 | $42,420 |
| 2016 | $3,906 | $54,010 | $14,950 | $39,060 |
| 2015 | $3,910 | $54,010 | $14,950 | $39,060 |
| 2014 | $3,879 | $54,010 | $14,950 | $39,060 |
| 2013 | $1,926 | $54,005 | $14,945 | $39,060 |
Source: Public Records
Map
Nearby Homes
- 536 Springwood Lake Dr
- 388 Elkwood Place
- 3877 Hines Rd
- 638 Thistle Ave
- 642 Ridenour Rd
- 3118 Berkley Pointe Dr
- 3150 Berkley Pointe Dr
- 295 Imperial Dr
- 343 Amesbury Dr
- 4125 Emerius Dr
- 249 Regents Rd
- 2741 Acarie Dr
- 209 Imperial Dr
- 221 Lincolnshire Rd
- 2694 Kantian Dr
- 459 Bluestem Ave
- 402 Bluestem Ave
- 491 Daventry Ln
- 3555 Tami Place
- 3544 Halpern St
- 707 Woodmark Run
- 713 Woodmark Run
- 691 Woodmark Run
- 506 Mccutcheon Rd
- 530 Tall Oaks Dr
- 505 Waring Way
- 719 Woodmark Run
- 690 Woodmark Run
- 513 Waring Way
- 536 Tall Oaks Dr
- 531 Tall Oaks Dr
- 684 Woodmark Run
- 3754 Mccutcheon Rd
- 537 Tall Oaks Dr
- 540 Tall Oaks Dr
- 493 Waring Way
- 680 Woodmark Run
- 499 Waring Way
- 674 Woodmark Run
- 514 Waring Way