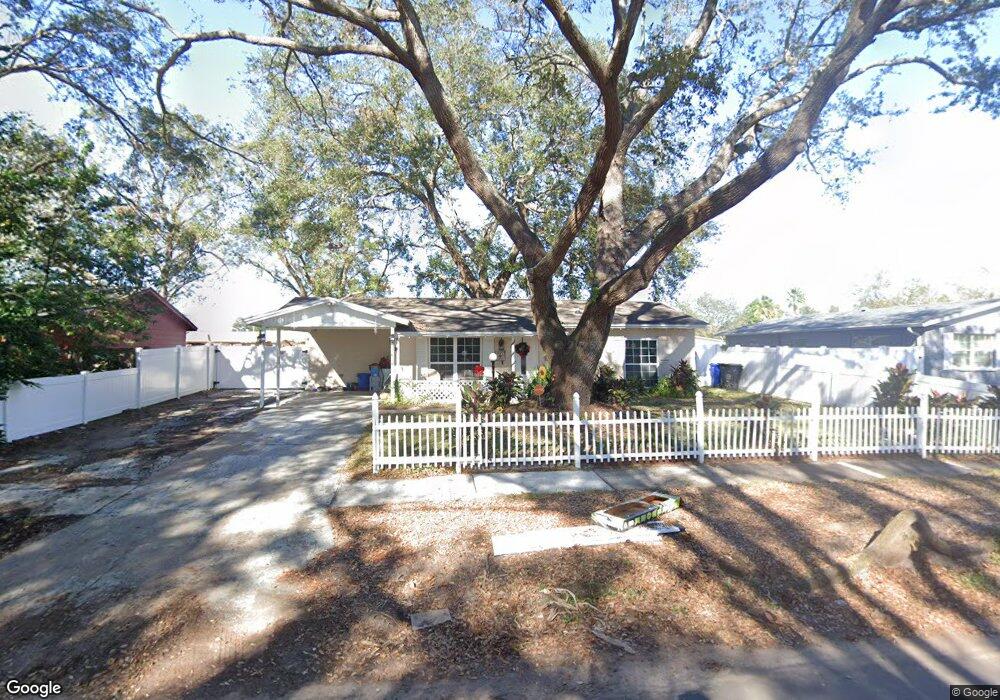
7030 Flint Dr Tampa, FL 33619
Great Palm River Point NeighborhoodEstimated Value: $318,055 - $336,000
3
Beds
1
Bath
1,127
Sq Ft
$289/Sq Ft
Est. Value
About This Home
This home is located at 7030 Flint Dr, Tampa, FL 33619 and is currently estimated at $325,764, approximately $289 per square foot. 7030 Flint Dr is a home located in Hillsborough County with nearby schools including Bing Elementary School, Giunta Middle School, and Spoto High School.
Ownership History
Date
Name
Owned For
Owner Type
Purchase Details
Closed on
Jun 26, 2023
Sold by
Florida Home Offerings Llc and Velox Llc
Bought by
Hernandez Armando and Galarza Stephany
Current Estimated Value
Home Financials for this Owner
Home Financials are based on the most recent Mortgage that was taken out on this home.
Original Mortgage
$50,629
Outstanding Balance
$49,329
Interest Rate
6.39%
Mortgage Type
Seller Take Back
Estimated Equity
$276,435
Purchase Details
Closed on
Jul 22, 2022
Sold by
Huntington Michael A and Huntington Cherry M
Bought by
Huntington Joshua and Huntington Kaitlynn
Home Financials for this Owner
Home Financials are based on the most recent Mortgage that was taken out on this home.
Original Mortgage
$230,056
Interest Rate
5.78%
Mortgage Type
FHA
Purchase Details
Closed on
Feb 21, 2014
Sold by
Johnson Hubert A and Johnson Sophia Victoria
Bought by
U S Bank National Association
Create a Home Valuation Report for This Property
The Home Valuation Report is an in-depth analysis detailing your home's value as well as a comparison with similar homes in the area
Home Values in the Area
Average Home Value in this Area
Purchase History
| Date | Buyer | Sale Price | Title Company |
|---|---|---|---|
| Hernandez Armando | $315,000 | First International Title | |
| Huntington Joshua | $260,000 | Amrock | |
| U S Bank National Association | -- | None Available |
Source: Public Records
Mortgage History
| Date | Status | Borrower | Loan Amount |
|---|---|---|---|
| Open | Hernandez Armando | $50,629 | |
| Previous Owner | Huntington Joshua | $230,056 |
Source: Public Records
Tax History Compared to Growth
Tax History
| Year | Tax Paid | Tax Assessment Tax Assessment Total Assessment is a certain percentage of the fair market value that is determined by local assessors to be the total taxable value of land and additions on the property. | Land | Improvement |
|---|---|---|---|---|
| 2024 | $3,732 | $222,399 | $59,840 | $162,559 |
| 2023 | $3,418 | $163,883 | $52,360 | $111,523 |
| 2022 | $936 | $55,610 | $0 | $0 |
| 2021 | $924 | $53,990 | $0 | $0 |
| 2020 | $860 | $53,245 | $0 | $0 |
| 2019 | $802 | $52,048 | $0 | $0 |
| 2018 | $799 | $51,078 | $0 | $0 |
| 2017 | $792 | $67,939 | $0 | $0 |
| 2016 | $702 | $45,908 | $0 | $0 |
| 2015 | $1,373 | $55,012 | $0 | $0 |
| 2014 | $1,297 | $52,073 | $0 | $0 |
| 2013 | -- | $46,759 | $0 | $0 |
Source: Public Records
Map
Nearby Homes
- 2067 Balfour Cir
- 7620 Dennison Dr
- 1716 Lancelot Loop
- 2406 S 68th St
- 7102 Reindeer Rd
- 2416 S 67th St
- 6605 24th Ave S
- 7112 Robindale Rd
- 2027 Warrington Way
- 1506 S 78th St
- 1721 Darlington Dr
- 7620 32nd Ave S
- 2030 Windsor Way
- 7420 Aripeka Dr
- 3508 S 75th St
- 8528 Gold Ridge Cir
- 7614 35th Ave S
- 8506 Lee Place
- 1009 S 70th St
- 3220 Lancaster Ln
- 7028 Flint Dr
- 7032 Flint Dr
- 2029 Balfour Cir
- 7026 Flint Dr
- 2031 Balfour Cir
- 7029 Flint Dr
- 7027 Flint Dr
- 2025 Balfour Cir
- 7031 Flint Dr
- 7024 Flint Dr
- 7025 Flint Dr
- 2040 Balfour Cir
- 2042 Balfour Cir
- 2023 Balfour Cir
- 2038 Balfour Cir
- 7023 Flint Dr
- 2030 Balfour Cir
- 2055 Balfour Cir
- 7022 Flint Dr
- 2028 Balfour Cir