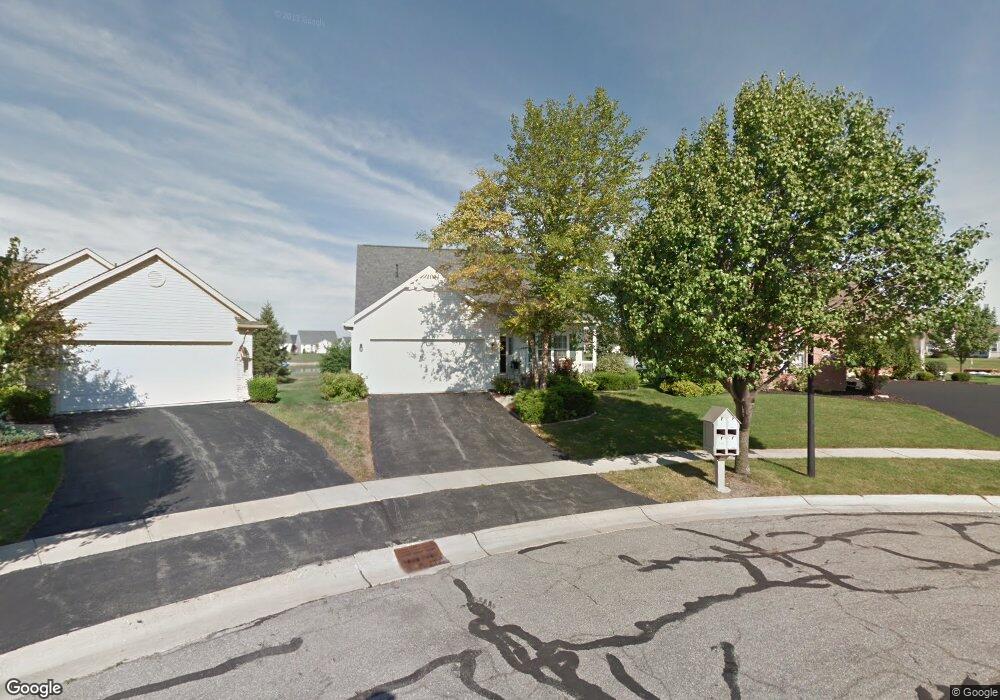
7030 Shoreview Ct Maumee, OH 43537
Estimated Value: $353,383 - $392,000
3
Beds
2
Baths
1,920
Sq Ft
$192/Sq Ft
Est. Value
About This Home
This home is located at 7030 Shoreview Ct, Maumee, OH 43537 and is currently estimated at $369,096, approximately $192 per square foot. 7030 Shoreview Ct is a home located in Lucas County with nearby schools including Anthony Wayne High School, St Joseph Catholic School, and Monclova Christian Academy.
Ownership History
Date
Name
Owned For
Owner Type
Purchase Details
Closed on
Nov 8, 2017
Sold by
Putry Sharon E
Bought by
Putry Sharon E
Current Estimated Value
Purchase Details
Closed on
Jul 28, 2017
Sold by
Catlow Ralph J and Catlow Deborah J
Bought by
Jagodzinski Dawn D and The Catlow Family Irrevocable Trust
Purchase Details
Closed on
Apr 11, 2008
Sold by
Kish Donald J and Kish Deborah J
Bought by
Catlow Ralph J and Catlow Deborah J
Home Financials for this Owner
Home Financials are based on the most recent Mortgage that was taken out on this home.
Original Mortgage
$205,478
Outstanding Balance
$130,974
Interest Rate
6.09%
Mortgage Type
Purchase Money Mortgage
Estimated Equity
$238,122
Purchase Details
Closed on
Mar 2, 2000
Sold by
Louisville Title Agency For Nw Ohio
Bought by
Kish Donald J and Kish Deborah J
Create a Home Valuation Report for This Property
The Home Valuation Report is an in-depth analysis detailing your home's value as well as a comparison with similar homes in the area
Home Values in the Area
Average Home Value in this Area
Purchase History
| Date | Buyer | Sale Price | Title Company |
|---|---|---|---|
| Putry Sharon E | -- | None Available | |
| Jagodzinski Dawn D | -- | None Available | |
| Catlow Ralph J | $205,500 | First Capital Title Svcs Inc | |
| Kish Donald J | $48,800 | Louisville Title Agency For |
Source: Public Records
Mortgage History
| Date | Status | Borrower | Loan Amount |
|---|---|---|---|
| Open | Catlow Ralph J | $205,478 |
Source: Public Records
Tax History Compared to Growth
Tax History
| Year | Tax Paid | Tax Assessment Tax Assessment Total Assessment is a certain percentage of the fair market value that is determined by local assessors to be the total taxable value of land and additions on the property. | Land | Improvement |
|---|---|---|---|---|
| 2024 | $2,484 | $104,230 | $37,905 | $66,325 |
| 2023 | $4,754 | $90,230 | $31,535 | $58,695 |
| 2022 | $4,798 | $90,230 | $31,535 | $58,695 |
| 2021 | $4,697 | $90,230 | $31,535 | $58,695 |
| 2020 | $4,465 | $78,085 | $26,460 | $51,625 |
| 2019 | $4,340 | $78,085 | $26,460 | $51,625 |
| 2018 | $4,001 | $78,085 | $26,460 | $51,625 |
| 2017 | $3,878 | $67,410 | $21,490 | $45,920 |
| 2016 | $3,840 | $192,600 | $61,400 | $131,200 |
| 2015 | $3,681 | $192,600 | $61,400 | $131,200 |
| 2014 | $3,504 | $65,450 | $20,860 | $44,590 |
| 2013 | $3,504 | $65,450 | $20,860 | $44,590 |
Source: Public Records
Map
Nearby Homes
- 6948 Longwater Dr
- 7342 Harbour Light Ct
- 4339 Sage St
- 4351 Sage St
- 4402 Sage St
- 4332 Sage St
- 7250 Violet Ln
- 4335 Crystal Ridge Dr E
- 6740 Monclova Rd
- 6621 Monclova Rd
- 7231 Rolling Meadow Ln
- 4455 Post Office Cir
- 5120 Lake Breeze Ln
- 4228 Crystal Ridge Dr E
- 7465 Peppergrass Crossing
- 4369 Post Office Cir
- 4352 Post Office Cir
- 4346 Post Office Cir
- 4340 Post Office Cir
- 4334 Post Office Cir
- 7024 Shoreview Ct
- 7031 Shoreview Ct
- 7018 Shoreview Ct
- 7025 Shoreview Ct
- 7012 Shoreview Ct
- 7019 Shoreview Ct
- 7006 Shoreview Ct
- 7013 Shoreview Ct
- 7007 Shoreview Ct
- 7000 Shoreview Ct
- 7001 Shoreview Ct
- 7048 Nautica Ct
- 7054 Nautica Ct
- 6964 Shoreview Ct
- 6962 Shoreview Ct
- 6963 Shoreview Ct
- 7042 Nautica Ct
- 7060 Nautica Ct
- 7031 Longwater Dr
- 7037 Longwater Dr