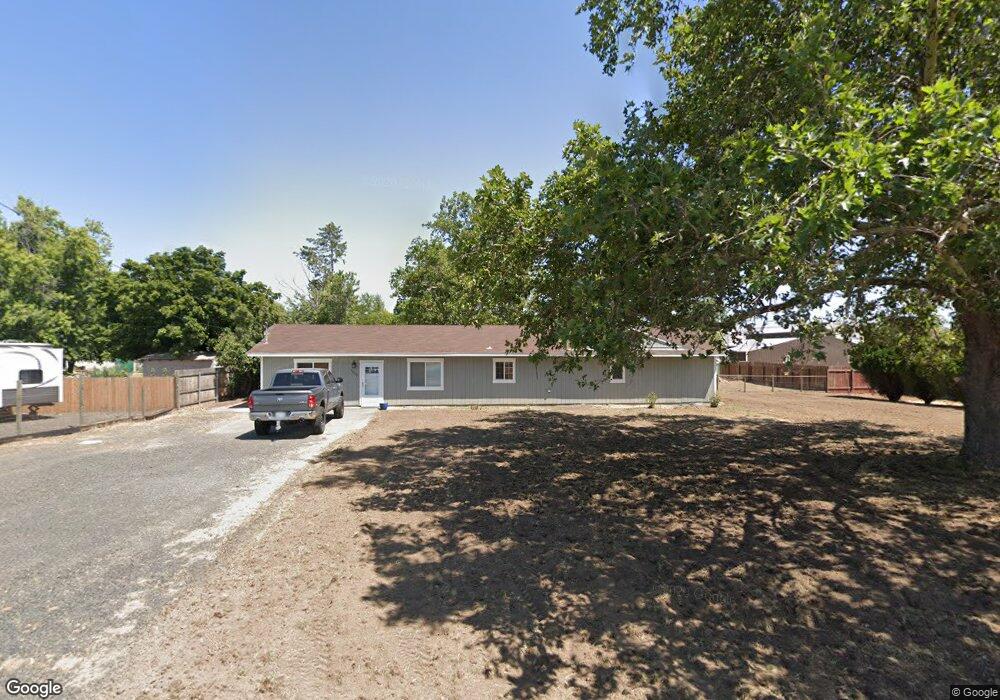
70319 Highway 395 S Pendleton, OR 97801
Estimated Value: $356,171 - $457,000
3
Beds
2
Baths
1,846
Sq Ft
$218/Sq Ft
Est. Value
About This Home
This home is located at 70319 Highway 395 S, Pendleton, OR 97801 and is currently estimated at $401,724, approximately $217 per square foot. 70319 Highway 395 S is a home located in Umatilla County with nearby schools including McKay Creek Elementary School, Sunridge Middle School, and Pendleton High School.
Ownership History
Date
Name
Owned For
Owner Type
Purchase Details
Closed on
Sep 15, 2020
Sold by
Ward Kacey A
Bought by
Ward Kacey A and Ward Sterrin B
Current Estimated Value
Home Financials for this Owner
Home Financials are based on the most recent Mortgage that was taken out on this home.
Original Mortgage
$261,600
Outstanding Balance
$209,217
Interest Rate
2.8%
Mortgage Type
New Conventional
Estimated Equity
$192,507
Purchase Details
Closed on
Jun 21, 2019
Sold by
Mccombs Jeremy and Mccombs Junelle
Bought by
Ward Kacey A
Home Financials for this Owner
Home Financials are based on the most recent Mortgage that was taken out on this home.
Original Mortgage
$260,200
Interest Rate
4.12%
Mortgage Type
FHA
Purchase Details
Closed on
Jul 2, 2015
Sold by
Blessinger John Byrd and Blessinger Jo Anne
Bought by
Mccombs Jeremy and Mccombs Junelle
Home Financials for this Owner
Home Financials are based on the most recent Mortgage that was taken out on this home.
Original Mortgage
$165,938
Interest Rate
3.75%
Mortgage Type
FHA
Create a Home Valuation Report for This Property
The Home Valuation Report is an in-depth analysis detailing your home's value as well as a comparison with similar homes in the area
Home Values in the Area
Average Home Value in this Area
Purchase History
| Date | Buyer | Sale Price | Title Company |
|---|---|---|---|
| Ward Kacey A | -- | Amerititle | |
| Ward Kacey A | $265,000 | Amerititle | |
| Mccombs Jeremy | $169,000 | Amerititle |
Source: Public Records
Mortgage History
| Date | Status | Borrower | Loan Amount |
|---|---|---|---|
| Open | Ward Kacey A | $261,600 | |
| Closed | Ward Kacey A | $260,200 | |
| Previous Owner | Mccombs Jeremy | $165,938 |
Source: Public Records
Tax History Compared to Growth
Tax History
| Year | Tax Paid | Tax Assessment Tax Assessment Total Assessment is a certain percentage of the fair market value that is determined by local assessors to be the total taxable value of land and additions on the property. | Land | Improvement |
|---|---|---|---|---|
| 2024 | $2,766 | $181,030 | $51,560 | $129,470 |
| 2023 | $2,702 | $175,760 | $50,060 | $125,700 |
| 2022 | $2,385 | $170,650 | $0 | $0 |
| 2021 | $2,382 | $165,680 | $47,190 | $118,490 |
| 2020 | $2,298 | $160,860 | $45,820 | $115,040 |
| 2018 | $1,927 | $140,350 | $71,000 | $69,350 |
| 2017 | $2,108 | $151,640 | $43,200 | $108,440 |
| 2016 | $1,730 | $124,500 | $62,000 | $62,500 |
| 2015 | $1,786 | $141,810 | $66,390 | $75,420 |
| 2014 | $1,697 | $141,810 | $66,390 | $75,420 |
Source: Public Records
Map
Nearby Homes
- 70349 Lakeside Rd
- 71539 SW Bridle Dr
- 72062 Westfield Blvd
- 1914 SW 2nd Dr
- 904 SW 43rd St
- 4207 SW Sheridan Ave
- 1901 SW Runnion Ln
- 0 SW 2nd St Unit 263926795
- 1703 SW 2nd St
- 0000 County 1031 Rd
- 1209 SW Zeta Ct
- 0 SW Quinney Ln Unit 24414661
- 1437 SW 40th St
- 0 Mckay Dr
- 1437 SW 37th St Unit 43
- 1328 SW 44th St
- 1206 SW 24th St
- 1004 SW 33rd St
- 3307 SW Kirk Ave
- 0 SW Kirk Ave Unit 200 21392184
- 70301 Highway 395 S
- 43743 Lariat Trail
- 70287 Highway 395 S
- 70244 Mountain View Rd
- 70228 Mountain View Rd
- 43754 Lariat Trail
- 70337 Highway 395 S
- 43746 Hackamore Trail
- 43763 Lariat Trail
- 43766 Lariat Trail
- 70251 Mountain View Rd
- 70371 Prairie Rd
- 70352 Lakeside Rd
- 70318 Lakeside Rd
- 43708 Buckboard Trail Rd
- 43776 Buckboard Trail Rd
- 70380 Lakeside Rd
- 43736 Smith Ln