Estimated Value: $247,000 - $290,000
3
Beds
2
Baths
1,456
Sq Ft
$186/Sq Ft
Est. Value
About This Home
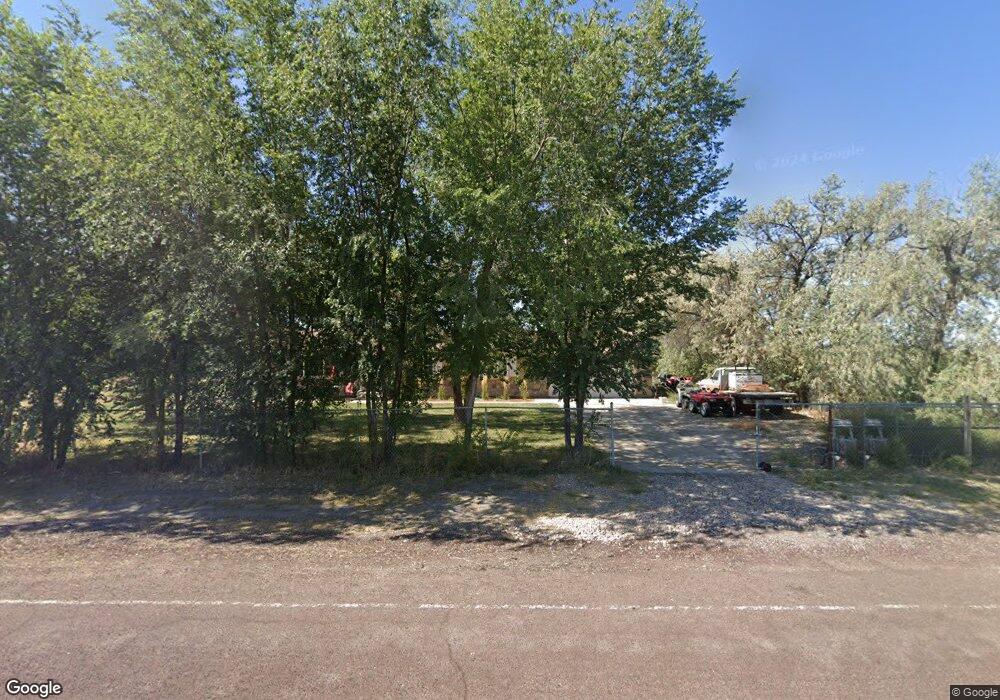
This home is located at 7035 N 2000 W, Delta, UT 84624 and is currently estimated at $270,794, approximately $185 per square foot. 7035 N 2000 W is a home located in Millard County.
Ownership History
Date
Name
Owned For
Owner Type
Purchase Details
Closed on
Jun 15, 2022
Sold by
Brown Scott Timothy
Bought by
Buswell Sean Aaron
Current Estimated Value
Home Financials for this Owner
Home Financials are based on the most recent Mortgage that was taken out on this home.
Original Mortgage
$242,424
Outstanding Balance
$230,298
Interest Rate
5.25%
Mortgage Type
New Conventional
Estimated Equity
$40,496
Purchase Details
Closed on
Mar 10, 2016
Sold by
Brown Scott T and Brown June P
Bought by
Brown Scott T
Home Financials for this Owner
Home Financials are based on the most recent Mortgage that was taken out on this home.
Original Mortgage
$93,400
Interest Rate
3.71%
Mortgage Type
New Conventional
Purchase Details
Closed on
Jun 18, 2013
Sold by
Garcia Carlos C and Garcia Isolda Ruiz
Bought by
Carcia Isolda Ruiz
Purchase Details
Closed on
Jul 26, 2006
Sold by
Gill Roslyn
Bought by
Garcia Carlos C and Garcia Soldy
Home Financials for this Owner
Home Financials are based on the most recent Mortgage that was taken out on this home.
Original Mortgage
$59,700
Interest Rate
6.76%
Mortgage Type
New Conventional
Create a Home Valuation Report for This Property
The Home Valuation Report is an in-depth analysis detailing your home's value as well as a comparison with similar homes in the area
Purchase History
| Date | Buyer | Sale Price | Title Company |
|---|---|---|---|
| Buswell Sean Aaron | -- | None Listed On Document | |
| Barragan Christalyn | -- | None Listed On Document | |
| Brown Scott T | -- | -- | |
| Carcia Isolda Ruiz | -- | -- | |
| Garcia Carlos C | -- | -- |
Source: Public Records
Mortgage History
| Date | Status | Borrower | Loan Amount |
|---|---|---|---|
| Open | Barragan Christalyn | $242,424 | |
| Closed | Buswell Sean Aaron | $242,424 | |
| Closed | Brown Scott T | $93,400 | |
| Previous Owner | Garcia Carlos C | $59,700 |
Source: Public Records
Tax History
| Year | Tax Paid | Tax Assessment Tax Assessment Total Assessment is a certain percentage of the fair market value that is determined by local assessors to be the total taxable value of land and additions on the property. | Land | Improvement |
|---|---|---|---|---|
| 2025 | $1,054 | $129,783 | $19,250 | $110,533 |
| 2024 | $1,054 | $136,340 | $13,750 | $122,590 |
| 2023 | $1,168 | $136,340 | $13,750 | $122,590 |
| 2022 | $985 | $87,245 | $13,750 | $73,495 |
| 2021 | $777 | $66,402 | $12,100 | $54,302 |
| 2020 | $747 | $64,296 | $12,100 | $52,196 |
| 2019 | $721 | $62,657 | $12,100 | $50,557 |
| 2018 | $659 | $58,696 | $12,100 | $46,596 |
| 2017 | $650 | $55,396 | $8,800 | $46,596 |
| 2016 | $621 | $55,396 | $8,800 | $46,596 |
| 2015 | $621 | $55,396 | $8,800 | $46,596 |
| 2014 | -- | $55,396 | $8,800 | $46,596 |
| 2013 | -- | $49,371 | $8,800 | $40,571 |
Source: Public Records
Map
Nearby Homes
Your Personal Tour Guide
Ask me questions while you tour the home.